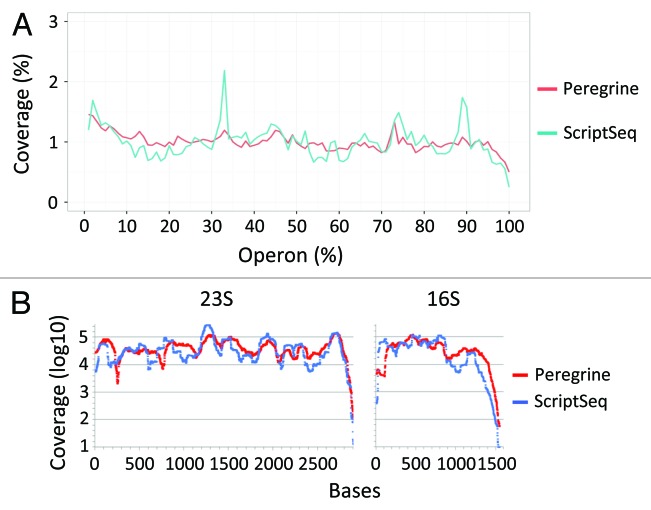
Figure 7. Uniformity of coverage along length of transcripts in Peregrine and ScriptSeq libraries prepared from E. coli K-12 RNA. Read statistics for the library sub-samples analyzed are included in Tables S3 and S4. (A) Average coverage at each percentile of length for all operons. Coverage depth was tabulated at each nucleotide position within each operon of > 1,000 bp. Each operon was length-normalized by percentile, and coverage was calculated as the total number of sequenced bases in each percentile divided by the total number of sequenced bases. The first percentile represents the 5′ end and the 100th percentile represents the 3′ end of the operon. (B) Average coverage at each nucleotide within the 23S (left panel) and 16S (right panel) rRNA, which have well-defined 5′ and 3′ ends.

An official website of the United States government
Here's how you know
Official websites use .gov
A
.gov website belongs to an official
government organization in the United States.
Secure .gov websites use HTTPS
A lock (
) or https:// means you've safely
connected to the .gov website. Share sensitive
information only on official, secure websites.
