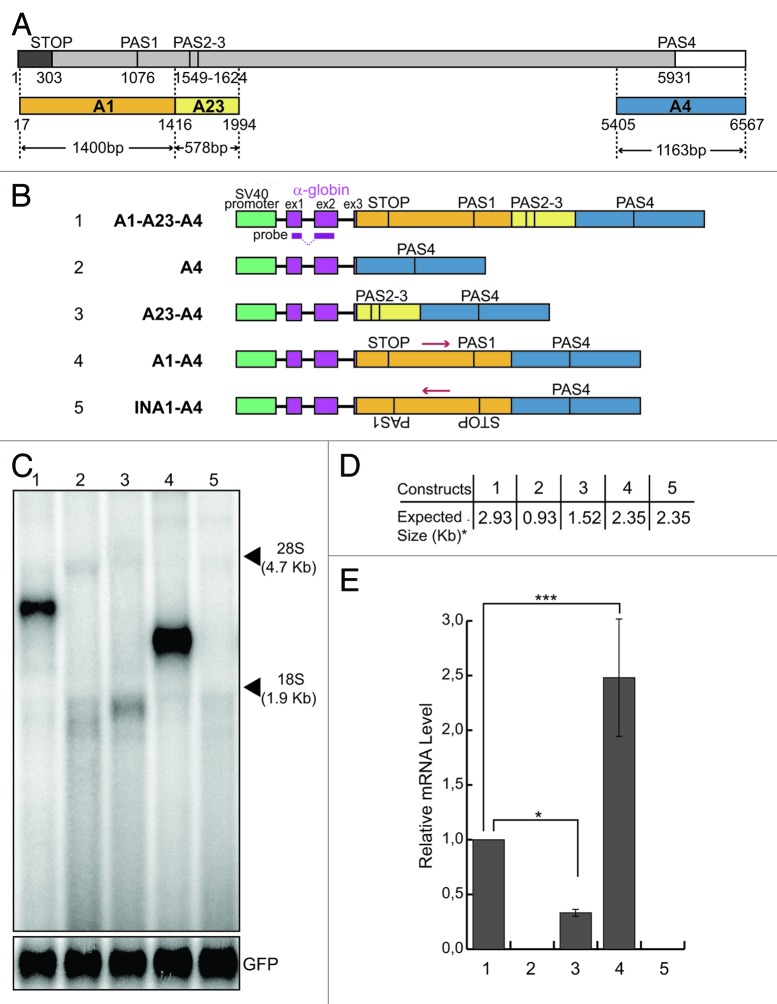
Figure 1. The presence of the A1 region is necessary to get mRNA expression. (A) Schematic representation of the Add2 last exon; numbers indicate nucleotide positions from the first base of the Add2 last exon; a dark gray box indicates the coding region; a light gray box indicates the 3′UTR; a white box indicates 3′genomic flanking region; STOP, stop codon; PAS1, the first polyadenylation site; PAS23, the second polyadenylation site; PAS4, the fourth polyadenylation site; different regions (A1, A23 and A4) containing Add2 polyadenylation sites (PAS1, PAS2-3 and PAS4) are represented as orange, yellow and blue boxes, respectively; arrowheads indicate the size of each region; (B) schematic representation of the Add2 chimeric minigene constructs A1-A23-A4 (1), A4 (2), A23-A4 (3), A1-A4 (4) and INA1-A4 (5); the green box indicates the SV40 promoter; violet boxes indicate exons of the α globin gene; the α globin fragment used as a probe for the northern blots is indicated; (C) northern blot analysis of total RNA prepared from HeLa cells previously transfected with the constructs shown in (B); the p-EGFP-C2 plasmid was used for the normalization of the transfection efficiency, the positions of the 28S and 18S rRNAs are indicated on the right; (D) the expected sizes of the mRNAs of the constructs shown in Panel B, up to the predicted PAS4 (i.e., the asterisk indicates without the pA tail). (E) The relative mRNA levels were calculated as the ratio between the analyzed mRNAs and GFP mRNA represented in (C); quantification of the northern blot signals was performed using the Cyclone Phosphorimager and the OptiQuant software (Packard); the mean +/− SD of three independent experiments is shown; data were analyzed using one-way ANOVA and Tukey's multiple comparison test; *** p < 0.0001, * p < 0.05.

An official website of the United States government
Here's how you know
Official websites use .gov
A
.gov website belongs to an official
government organization in the United States.
Secure .gov websites use HTTPS
A lock (
) or https:// means you've safely
connected to the .gov website. Share sensitive
information only on official, secure websites.
