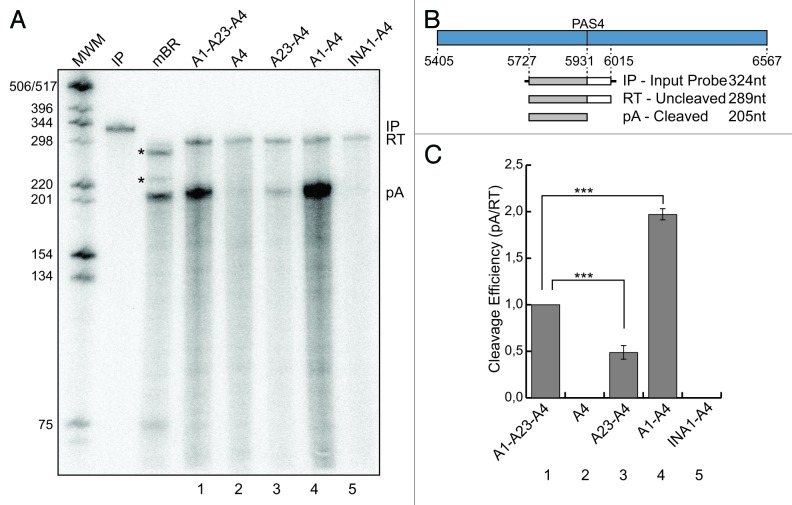
Figure 2. Cleavage efficiency of the pre-mRNA is enhanced by the presence of the A1 region. (A) RNase protection analysis of total RNA prepared from mouse brain (mBR) and HeLa cells previously transfected with the constructs shown in Figure 1B (1–5); IP, input probe; RT, uncleaved protected product; pA, cleaved protected product; MWM, molecular weight marker; the asterisks indicate unidentified products in the mBR sample. (B) Schematic representation of the A4 region containing PAS4 and the probe used in the RNase protection experiment shown below; the expected protected fragments, with their expected sizes are shown; nucleotide positions are numbered respective to the first base of the Add2 last exon. (C) The cleavage efficiency was calculated as the ratio between pA and RT represented in (A, 1–5). The quantification of the protected signals has been performed using the Cyclone Phosphorimager and the OptiQuant software (Packard); the mean +/− SD of three independent experiments is shown; data were analyzed using one-way ANOVA and Tukey's multiple comparison test,;*** p < 0.0001.

An official website of the United States government
Here's how you know
Official websites use .gov
A
.gov website belongs to an official
government organization in the United States.
Secure .gov websites use HTTPS
A lock (
) or https:// means you've safely
connected to the .gov website. Share sensitive
information only on official, secure websites.
