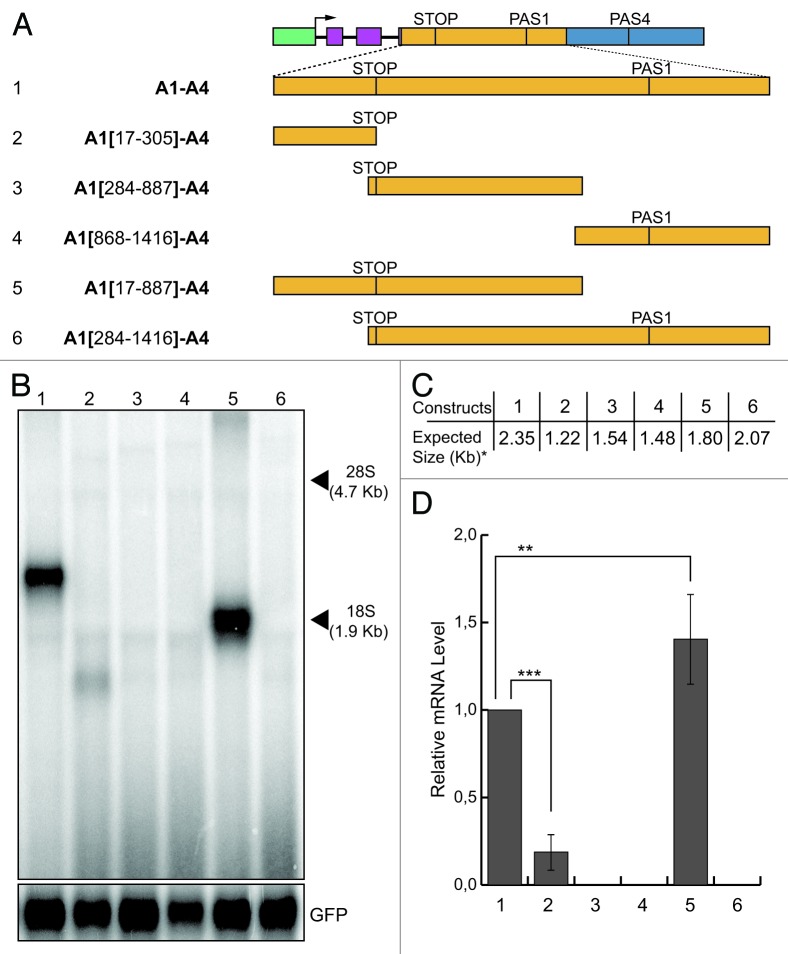
Figure 4. Mapping of the enhancer element present in the A1 region. (A) Schematic representation of the chimeric minigene constructs: A1-A4 (1), A1(17-305)-A4 (2), A1(284-887)-A4 (3), A1(868-1,416)-A4 (4), A1(17-887)-A4 (5) and A1(284-1,416)-A4 (6). (B) Northern blot analysis of total RNA prepared from HeLa cells previously transfected with the constructs shown in panel A; the α globin fragment used as a probe for the northern blots is indicated in Figure 1; the p-EGFP-C2 plasmid was used for the normalization of the transfection efficiency; the positions of the 28S and 18S rRNAs are indicated on the right; (C) the expected sizes of the mRNAs of the constructs shown in (A), up to the predicted PAS4 (i.e., the asterisk indicates without the pA tail). D: the relative mRNA levels were determined as described for Figure 1; the mean +/− SD of three independent experiments is shown; data were analyzed using one-way ANOVA and Tukey's multiple comparison test,; *** and ** indicate p < 0.0001 and p < 0.01, respectively.

An official website of the United States government
Here's how you know
Official websites use .gov
A
.gov website belongs to an official
government organization in the United States.
Secure .gov websites use HTTPS
A lock (
) or https:// means you've safely
connected to the .gov website. Share sensitive
information only on official, secure websites.
