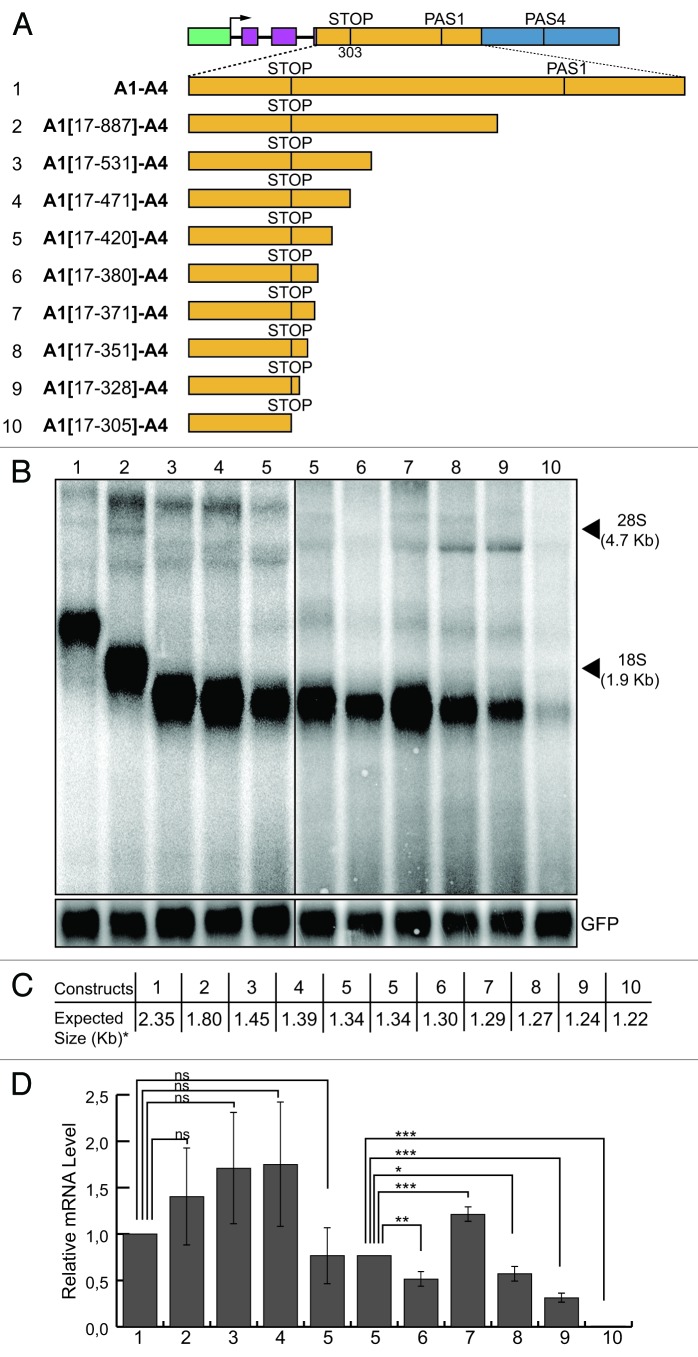
Figure 6. Mapping of the enhancer element present in the A1 region: sequences downstream of the stop codon. (A) Schematic representation of the chimeric minigene constructs: A1-A4 (1), A1(17–887)-A4 (2), A1(17–531)-A4 (3), A1(17-471)-A4 (4), A1(17-420)-A4 (5), A1(17-380)-A4 (6), A1(17-371)-A4 (7), A1(17-351)-A4 (8), A1(17-328)-A4 (9) and A1(17-305)-A4 (10). (B) northern blot analysis of total RNA prepared from HeLa cells previously transfected with the constructs shown in (A); the α globin fragment used as a probe for the northern blots is indicated in Figure 1; the p-EGFP-C2 plasmid was used for the normalization of the transfection efficiency; the positions of the 28S and 18S rRNAs are indicated on the right. (C) The expected sizes of the mRNAs of the constructs shown in (A), up to the predicted PAS4 (i.e., the asterisk indicates without the pA tail). (D) The relative mRNA levels were determined as described for Figure 1; the mean +/− SD of three independent experiments is shown; data were analyzed using one-way ANOVA and Tukey's multiple comparison test; *** p < 0.001, ** p < 0.01, * p < 0.05, ns, not significant.

An official website of the United States government
Here's how you know
Official websites use .gov
A
.gov website belongs to an official
government organization in the United States.
Secure .gov websites use HTTPS
A lock (
) or https:// means you've safely
connected to the .gov website. Share sensitive
information only on official, secure websites.
