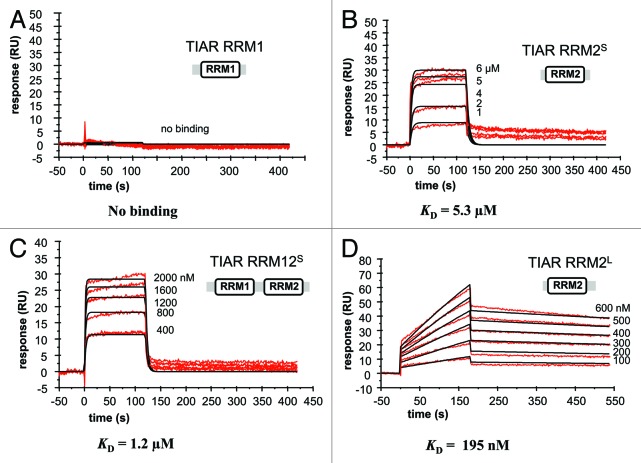
Figure 2. Kinetic analysis of the interactions of different TIAR constructs with U-rich RNA using SPR. The binding of (A) TIAR1, (B) TIAR2S, (C) TIAR12S and (D) TIAR2L to a U-rich RNA is shown. Biotinylated RNA was captured on SA-coated sensor chip and increasing concentrations of protein were injected over the surface. Injections were performed for 120 sec (association phase), followed by a 300 sec flow of running buffer to assess dissociation. The experiments were conducted in duplicate and showed good overlap. The red line represents the binding responses for injections of protein analyte at specified concentration over the RNA surface. The kinetic data were fit by a 1:1 Langmuir binding model. Mass transport effects were not evident. The black curves superimposed on top of the sensor grams represent the model fitted curves. The rate constants ka and kd were determined simultaneously as global fitting parameters from which the KD was determined. The resulting parameter values are given in Table 1.

An official website of the United States government
Here's how you know
Official websites use .gov
A
.gov website belongs to an official
government organization in the United States.
Secure .gov websites use HTTPS
A lock (
) or https:// means you've safely
connected to the .gov website. Share sensitive
information only on official, secure websites.
