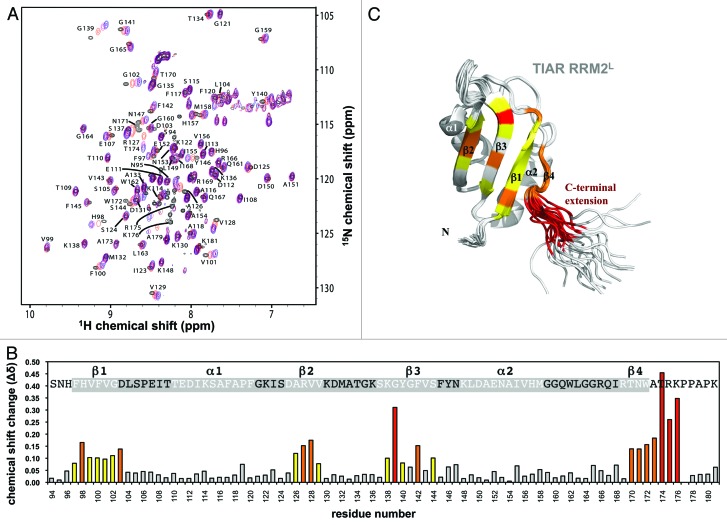
Figure 4. Perturbations of TIAR2L chemical shifts upon RNA binding. (A) An overlay of the assigned (15N,1H)-HSQC spectra of TIAR2L alone and in complex with different concentrations of 6-nt AU-rich RNA (5′-UUAUUU-3′). The molar ratio of TIAR2L to RNA is 1:0 (black), 1:0.4 (red), 1:0.8 (pink) and 1:1.2 (blue). (B) Chemical shift perturbation values for each residue were calculated at the TIAR2L to RNA 1:1.2 ratio as Δδ = {[0.154 (δ15N)2+ 0.25 (δ13Cα)2+ 0.25 (δ13Cβ)2+ (δ1H)2]/4}1/2 and plotted against the amino acid sequence of TIAR2L. The 20 residues showing the largest perturbations upon RNA-binding are colored (red > 0.20 ppm; orange > 0.14 ppm; yellow > 0.08 ppm). (C) Cartoon representation of the TIAR RRM2 structure (PDB ID: 2DH7) with residues affected by RNA-binding colored as in (B) with residues that showed lesser chemical shift perturbations upon RNA binding colored gray.

An official website of the United States government
Here's how you know
Official websites use .gov
A
.gov website belongs to an official
government organization in the United States.
Secure .gov websites use HTTPS
A lock (
) or https:// means you've safely
connected to the .gov website. Share sensitive
information only on official, secure websites.
