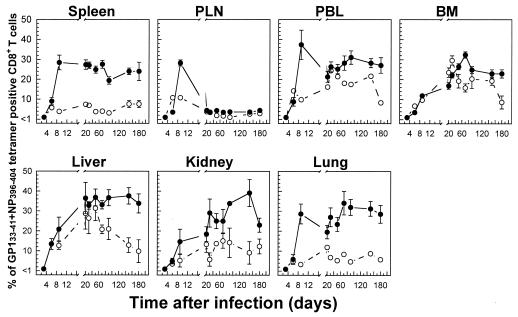
FIG. 5.
Tissue-specific kinetics of the virus-specific CD8+ T-cell response based on percentages of CD8+ T cells that were tetramer positive during acute versus persistent infections. The percentages of total CD8+ T cells specific for GP133-41 or NP396-404 in the indicated tissues, as determined by tetramer staining, were calculated based on the data presented in Fig. 1 for acute infections (•) or in Fig. 2 for persistent infections (○) of C57BL/6 mice with LCMV-Docile. Data shown are means ± SEM of log10 virus-specific T cells per tissue for 5 to 10 mice.

