
Figure 3.
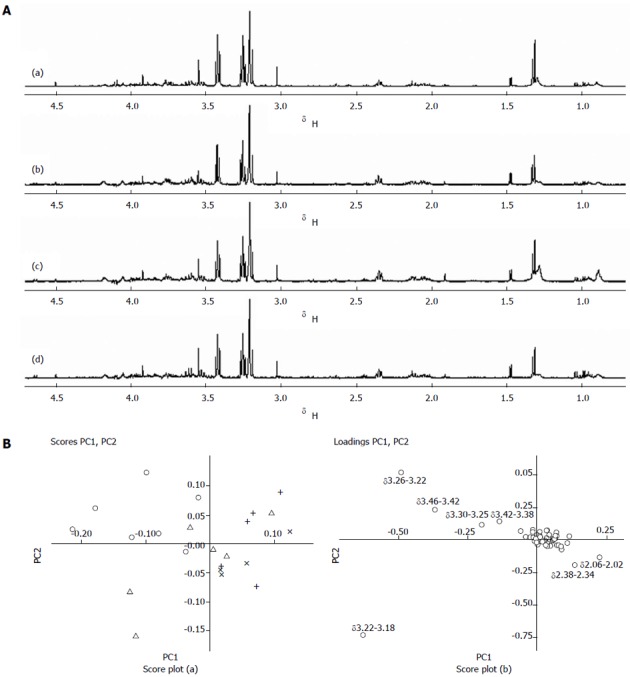
High-resolution magic angle spinning proton magnetic resonance spectroscopy spectra of transplanted pancreatic tumor after radiotherapy (500 mHz). A: Untreated group(a); 10 Gy treatment group (b); 20 Gy treatment group (c); 30 Gy treatment group (d); B: Principal component analysis to compare the metabolic profiles of the pancreatic tumor after radiotherapy based on the high-resolution magic angle spinning proton magnetic resonance spectroscopy spectra. Panels (a) and (b) are scores and loadings plots. ❍: Untreated group; ∆: 10 Gy treatment group; ×: 20 Gy treatment group; +: 30 Gy treatment group.