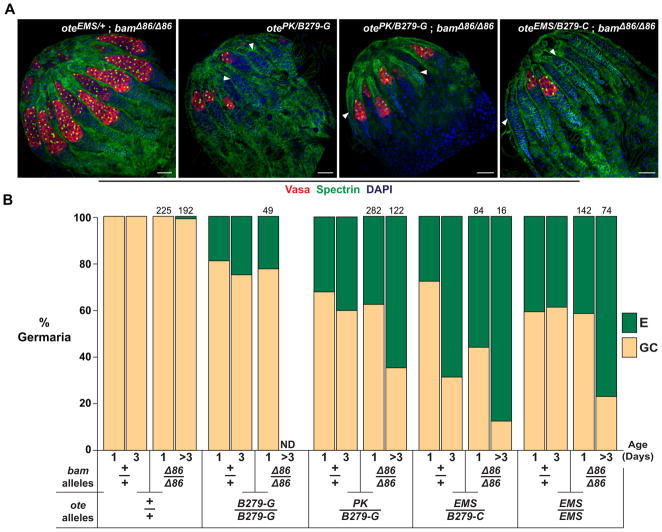
Figure 5. Loss of Bam does not rescue GSC loss in ote−/− ovaries.
A. Shown are confocal images of ovaries obtained from one-day-old females stained for Vasa (red), Spectrin (green) and DAPI (blue). The anterior of each ovary is oriented toward the top left corner. Arrowheads indicate empty germaria. Genotypes are listed in the top right corner. Scale bars represent 25 μm. B. Shown is a graph of the quantification of the prevalence of germaria without (empty, E) or with germ cells (germ cell containing, GC) in ovaries of wild type and mutant females. Ovary genotypes are listed below each bar. Data for the ote+/+, bam+/+ and ote−/−, bam+/+ genotypes represent a re-categorization of data presented in Figure 1D, wherein the WT, F, S+F and S classes of germaria are encompassed in the GC category. The total number of bam−/− germaria scored is indicated above each bar. ND (Not Determined).

