Figure 2.
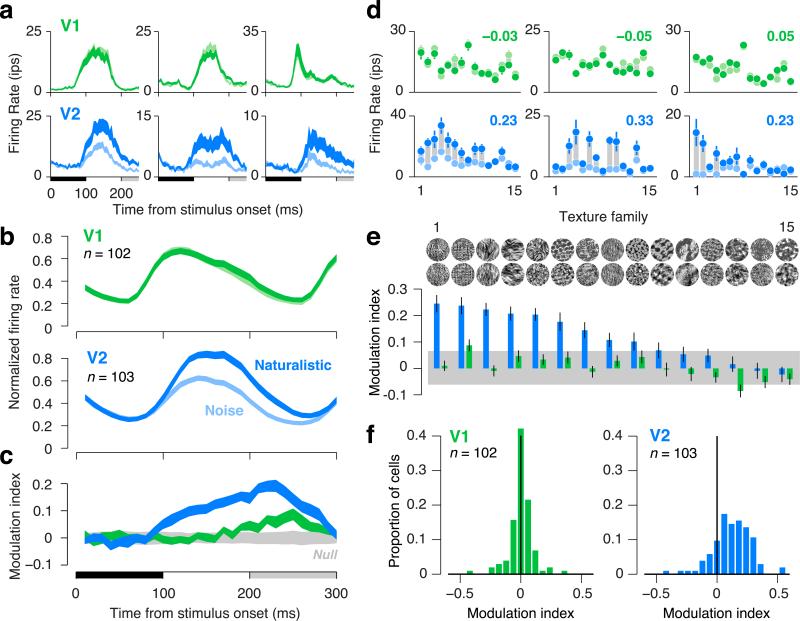
Neuronal responses to naturalistic textures differentiate V2 from V1 in macaques. (a) Time course of firing rate for three single units in V1 (green) and V2 (blue) to images of naturalistic texture (dark) and spectrally-matched noise (light). Thickness of lines indicates s.e.m. across texture families. Black horizontal bar indicates the presentation of the stimulus; gray bar indicates the presentation of the subsequent stimulus. (b) Time course of firing rate averaged across neurons in V1 and V2. Each neuron's firing rate was normalized by its maximum before averaging. Thickness of lines indicates s.e.m. across neurons. (c) Modulation index, computed as the difference between the response to naturalistic and the response to noise, divided by the sum. Modulation was computed separately for each neuron and texture family, then averaged across all neurons and families. Thickness of blue and green lines indicates s.e.m. across neurons. Thickness of gray shaded region indicates the 2.5th and 97.5th percentiles of the null distribution of modulation expected at each time point due to chance. (d) Firing rates for three single units in V1 (green) and V2 (blue) to naturalistic (dark dots) and noise (light dots), separately for the 15 texture families. Families are sorted according to the ranking in panel e. Gray bars connecting points are only for visualization of the differential response. Modulation indices (averaged across texture families) are reported in the upper right of each panel. Error bars indicate s.e.m. across the 15 samples of each texture family. (e) Diversity in modulation across texture families, averaged across all neurons. Error bars indicate s.e.m. across neurons. Gray bar indicates 2.5th and 97.5th percentiles of the null distribution of modulation expected due to chance. (f) Distributions of modulation indices across single neurons in V1 and V2. For each neuron, the modulation index for each texture family was computed on firing rates averaged within an 100 ms window following response onset, and modulation was then averaged across families.

