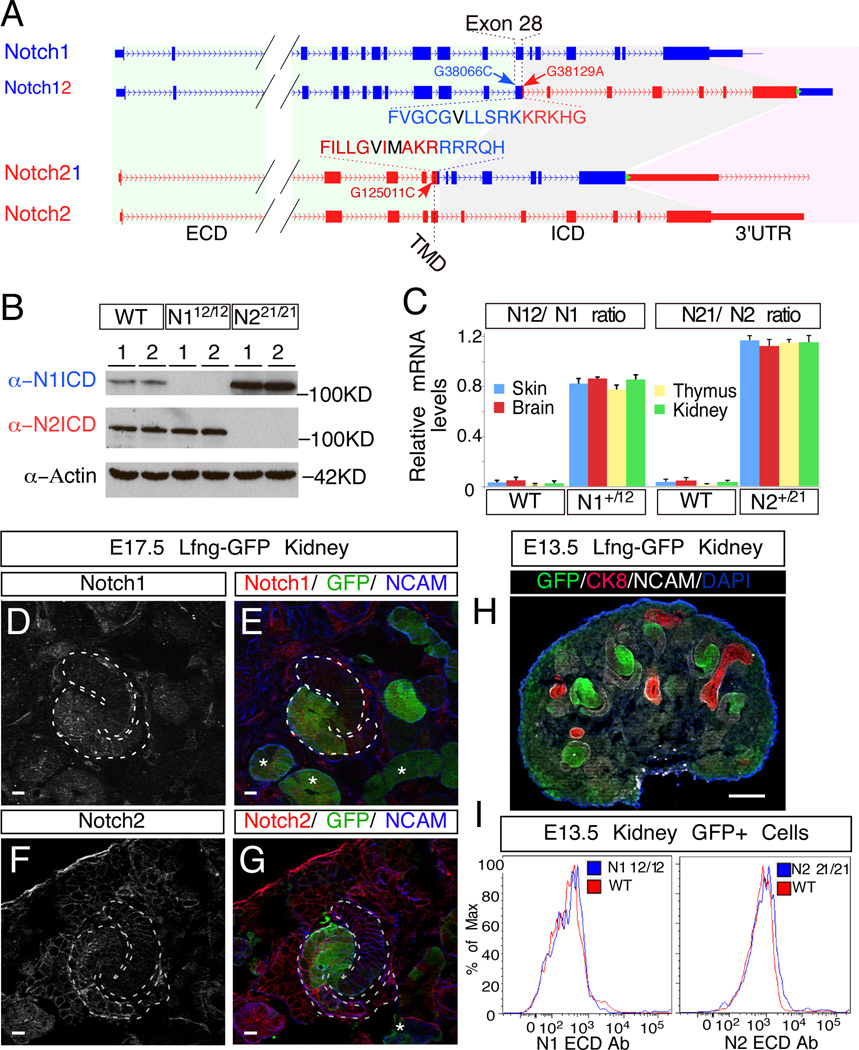
Figure 2.
Generation of the N12 and N21 alleles. (A) Schematic illustration of N1 (blue) and N2 (red) loci before and after the ICD swap. The N1 ICD encompasses 5,926bp on chromosome 2, ranging from nucleotide +38,103 to +44,028 (A in ATG is +1) and encoding amino acid 1,750 to 2,531; for N2, the ICD encompasses 8,699bp on chromosome 3, ranging from nucleotide +125,048 to +133,746 and encoding amino acid 1,705 to 2,473. Amino acids in black denote the S3 cleavage sites. Green triangle denotes FRT site. (B) Western blot analyses with ICD-specific antibodies of kidney extracts from newborn pups with designated genotypes (WT, N112/12 and N221/21; two different individuals per genotype). (C) mRNA level comparisons between chimeric N12 and N21 and their corresponding endogenous alleles in various tissues of wild type (WT), N1+/12 and N2+/21 newborn pups. Allele ratios were calculated by determining the G/C ratio at SNVs G38066C and G125011C introduced into the targeting constructs with pyrosequencing. Error bars represent standard deviation. (D–G) Double staining of EGFP and N1 (D and E) or N2 (F and G) on E17.5 Lfng-GFP kidneys. Asterisks (*) denote EGFP+ tubules. (H) EGFP labeling patterns in E13.5 Lfng-GFP kidney. (I) E13.5 Lfng-GFP kidneys with wild type (WT) or single homozygous (N112/12 or N221/21) Notch alleles were dissociated into single cells, stained with PE-conjugated N1 or N2 ECD-specific antibodies (eBioscience) and analyzed with flow cytometry. The cell surface levels of wild type (N1, N2) and chimeric (N12, N21) were compared in EGFP+ cells. Scale bars in D-G are 10µm and the one in H is 100µm. See also Figure S2, S3.

