Figure 7.
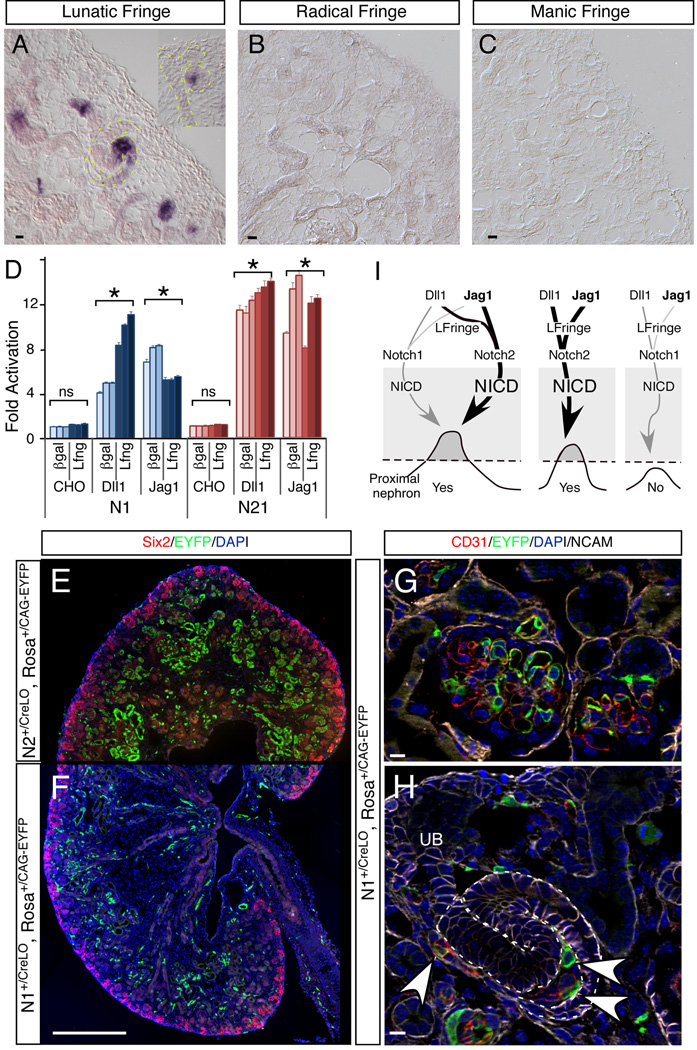
The dominance of N2 in the developing kidney can be explained by a combination of factors that are mediated by the ECD: higher cell surface expression, greater responsiveness to ligand and selective modulation by Lfng. (A–C) In situ hybridization of three fringe genes in the developing kidney. (D) Effects of Lfng modification on Notch1 and Notch21 activation in HEK293 cells (* denotes p<0.05, Student T-test). All scale bars represent standard deviation. (E–H) Comparison of the labeling pattern between N2∷CreLO (E) and N1∷CreLO (F–H) in vivo in developing nephrons. Arrowheads denote endothelial cells. (I) A model proposing a NICD-dependent switch that regulates proximal nephron development and explaining how N2 achieves its dominant roles over N1. See discussion for details. The weight of lines indicates the weight of effects. Scale bars: (A–C), (G–H) 10µm; (E, F) 500µm.

