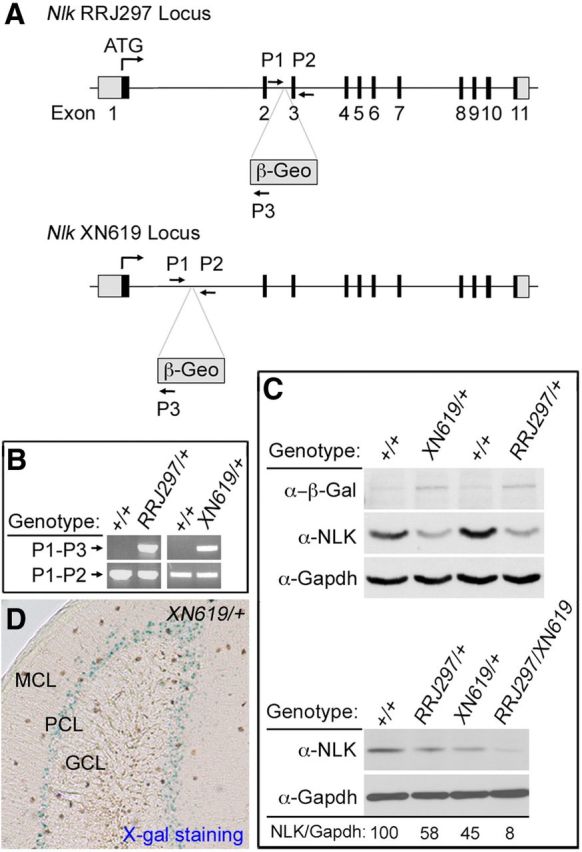
Figure 4.

Generation and evaluation of Nlk gene trapped mice. A, Schematic representation of the gene trapped Nlk locus. The Nlk locus is disrupted by insertion of the gene trap within the first or the second intron. Exons are depicted as numbered boxes. Primers used for genotyping are shown as lettered arrows (P1, P2, and P3). B, PCR genotyping of tail tip genomic DNA using the primer set shown in A. Primers P1 and P2 create a product in the absence of the gene trap, whereas primers P1 and P3 create a product in the presence of the gene trap. C, Western blot analysis of cerebellar extracts from WT (Nlk+/+), heterozygous (NlkRRJ297/+ and NlkXN619/+), and compound heterozygous mutant (NlkRRJ297/XN619) mice. NLK expression level relative to Gapdh is shown (%). D, Strong LacZ expression of the Nlk gene trap is observed within the Purkinje cell layer from 6-week-old NlkXN619/+ mouse cerebellum. MCL, Molecular cell layer; PCL, Purkinje cell layer; GCL, granular cell layer.
