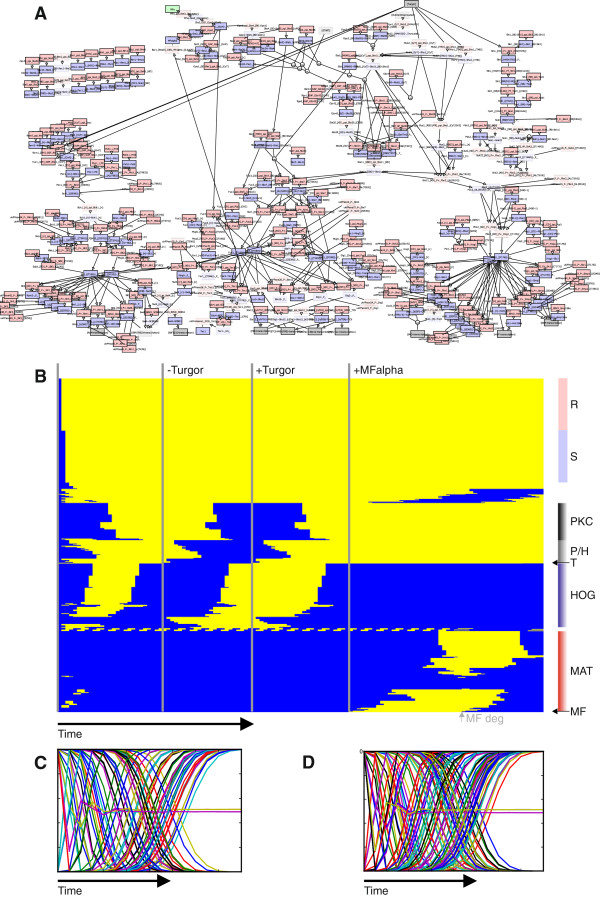
Figure 4.
Simulation of the complete MAP kinase network within the rxncon Boolean simulator. (A) Snapshot of the simulation. The network was generated from Additional file 4: Table S4 and the layout was imported from Additional file 5. (B) State evolution of the MAPK network displayed as heat map. Yellow and blue indicate active (True) and inactive (False) nodes, respectively. Grey vertical lines indicate simulation start and perturbations after the system reaches its steady states. Simulation starts using the default settings (+Turgor, -MFalpha, -Ste3, +Tec1; Figure 5). When it reaches the steady state, turgor (T) is turned off (t=27), then switched on again (t=50) and finally we add MFalpha (MF; t=75), which is degraded as the cells adapt (grey arrow; “MF deg”). The Pathway components cluster together in their state evolution (See Methods), including a group of early PKC pathway components that cluster with the components of the (negative) Sln-branch of the Hog pathway (P/H). Most mating pathway components (MAT) are first activated and then deactivated after their activation lead to mating factor degradation (MF deg; a negative feedback). The unregulated reactions (R) and states (S) are turned on at time step 1 and 2, respectively, and stay constitutively active. (C, D) Asynchronous simulation of the network from the default steady state (t=25 in B). The lineplots show the average of 1000 simulations for each variable that change during the simulation: (C) MFalpha stimulation and (D) Osmotic shock. Nearly all variables reach the same states in each of the simulation. The only exceptions are four connected variables that form a small negative feedback cycle that constitute a small cyclic attractor in the synchronous updating, which ends in a randomly chosen point attractor in each of the asynchronous simulations (one pair on, the other pair off).

