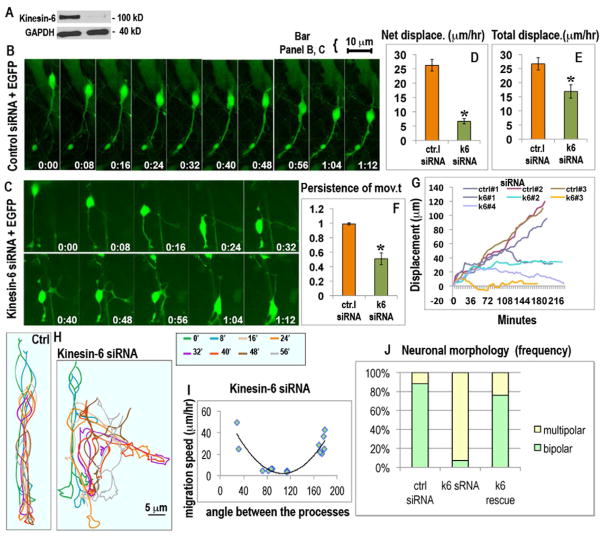
Figure 2.
Effect of siRNA-mediated depletion of kinesin-6 on migration and morphology of cerebellar granule neurons in vitro. (A) Western blot for kinesin-6 and GAPDH in dissociated cerebellar cells transfected with control siRNA (left lane) or kinesin-6 siRNA (right lane) for 72 hr, showing more than 90% depletion of kinesin-6 protein. (B) Migration of cerebellar neurons co-transfected with control siRNA, EGFP and (C) kinesin-6 siRNA, EGFP as represented by images captured 4 min apart; see also video 1. (D, E, F) Average net displacement per hr, average total displacement per hr and average persistence of movement for control and kinesin-6-depleted neurons. Error bars represent SEM. (G) Tracings of movements of somas of 3 control neurons (upper 3 lines) and 4 kinesin-6-depleted neurons (lower four lines). (H) Tracings of cell shape of a migrating neuron transfected with control siRNA (on the left) or kinesin-6 siRNA (on the right). Different time frames were traced in different colors and this color code is explained in the box on the side. (I) Correlation between the angle between the processes and migration speeds for individual cells for the kinesin-6 siRNA group. (J) Quantification of cell morphology in control, kinesin-6 siRNA and “kinesin-6 siRNA plus kinesin-6-GFP” (rescue) groups. See supplemental figure 2 for the effect of kinesin-6 depletion on centrosome movements and the kinesin-6 overexpression phenotype.

