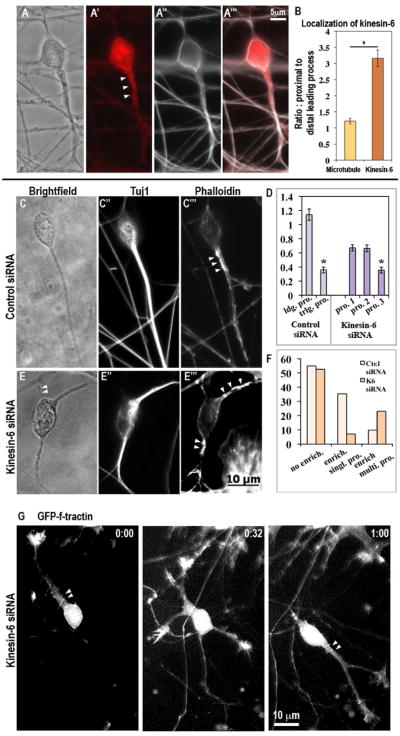
Figure 3.
Kinesin-6 immunostaining in cultured cerebellar granule neurons and effect on actin distribution. (A-A‴, B) Kinesin-6 and alpha-tubulin (to reveal microtubules) co-immunostaining in cerebellar granule neuron. Note that alpha-tubulin (microtubule) staining does not show enrichment in the proximal leading process whereas kinesin-6 staining is enriched. Immunostaining for Tuj1 (neuron-specific beta-III tubulin) and simultaneous staining with phalloidin to detect F-actin on neurons transfected with control siRNA (C-C‴) or kinesin-6 siRNA (E-E‴) after 72 hr. In the control siRNA group, a subset of cells showed strong F-actin enrichment in specific subcellular regions. In this subset, this enrichment was typically restricted to the proximal region of a single leading process, whereas in the kinesin-6 siRNA group, F-actin enrichment was often observed simultaneously in multiple processes. Arrowheads indicate F-actin enriched regions (D) Quantification of cellular morphology in terms of process thickness for cells transfected with control or kinesin-6 siRNA. In the control group, neurons possessed a single leading process, which can be defined by greater thickness of this process, whereas in the kinesin-6 group, neurons typically possessed 3 processes, 2 of which were of similar thickness. Effect of kinesin-6 depletion on microtubule dynamics was also analyzed (see supplemental figure 3). (F) Quantification of the proportion of neurons showing F-actin enrichment in the total population, and pattern of actin enrichment within this subset, in cultures that were transfected with control siRNA or kinesin-6 siRNA for 72 hr. (G) Live imaging of F-actin using GFP-F-tractin probe in kinesin-6 depleted cells.

