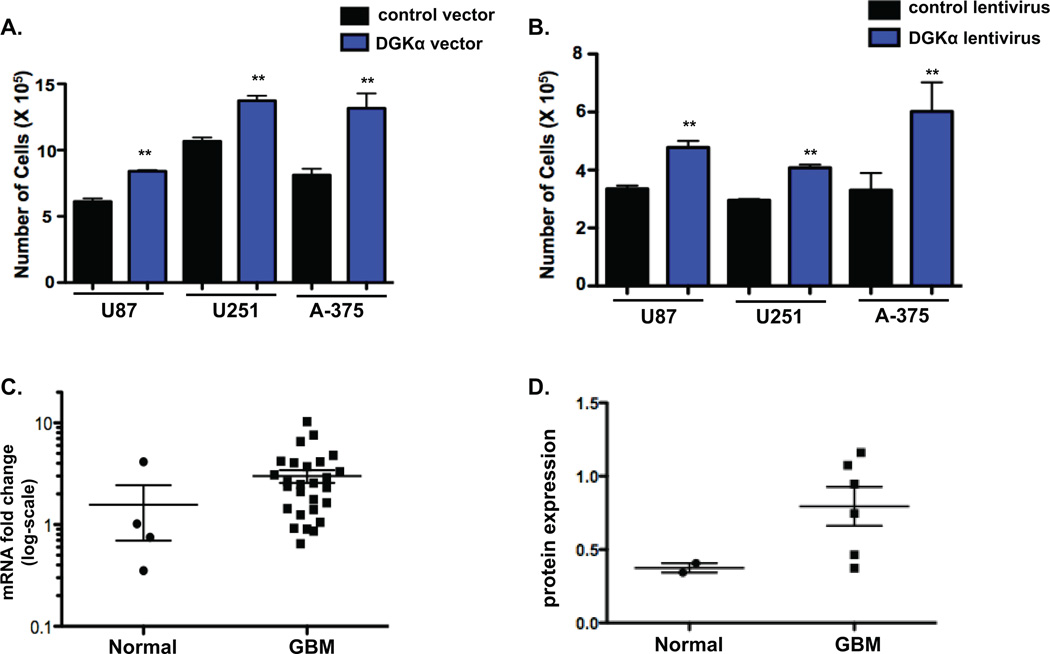
Figure 2. DGKα is up-regulated in GBM and increases cell numbers.
A, Cell numbers for U87 and U251 glioblastoma and A-375 melanoma cells were assessed 72 hours after over-expression of DGKα by plasmid transfection versus control plasmid (TOPO-TA plasmid, Invitrogen). B, DGKα was over-expressed via lentiviral infection in U87, U251 and A-375 cells to assess the effect on cell proliferation when compared to control cells. C, DGKα levels in human tissue samples were evaluated by measured intensity of immunoblot in GBM samples and compared to normal brain after normalizing by the ratio of DGKα intensity to α-tubulin intensity. D, DGKα mRNA levels were quantified by qRT-PCR and normalized by 18S RNA in normal versus GBM human tissue samples. The scatterplot exhibits the trend toward increased mRNA fold expression in GBM samples. (*, P<0.05 and **, P<0.01 Student t test)

