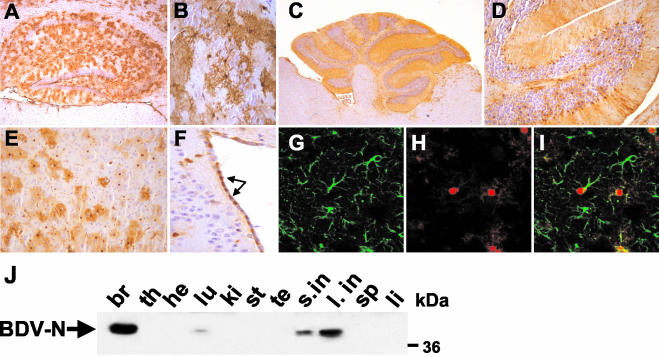
FIG. 2.
Cell- and tissue-specific expression pattern of BDV-N in Astro-N-25 transgenic mice. (A to I) Sagittal sections (8 μm in thickness) of paraffin-embedded brain hemispheres from 8- to 12-week-old Astro-N-25 mice were stained with anti-N MAb Bo18 (A to F) or a mixture of Bo18 and rabbit anti-GFAP (G to I). Bound antibodies were visualized using a biotinylated secondary antibody (A to F) or a mixture of Cy2-labeled anti-rabbit antibody and Cy3-labeled anti-mouse antibody (G to I). Sections in panels A to F were counterstained with hematoxylin. (A) Hippocampus; (B) CA3 region of hippocampus; (C) cerebellum; (D) 2.5-fold-higher magnification image of cerebellum; (E) frontal cortex; (F) ventricle wall (arrows point to N-expressing ependymal cells). (G to I) Confocal laser-scanning microscopy analysis of double-labeled cortical section. (G) anti-GFAP staining; (H) anti-N staining; (I) overlaid images from panels G and H. (J) Tissue-specific expression pattern of transgenic N. Organs were taken from a 6-week-old Astro-N-25 male and homogenized, 80-μg samples were subjected to SDS-PAGE, and immunoblotting using MAb Bo18 for detection of N was performed. Samples are from brain (br), thymus (th), heart (he), lung (lu), kidney (ki), stomach (st), testis (te), small intestine (s.in), large intestine (l. in), spleen (sp), and liver (li). The arrow indicates the BDV-N-specific band at about 40 kDa.

