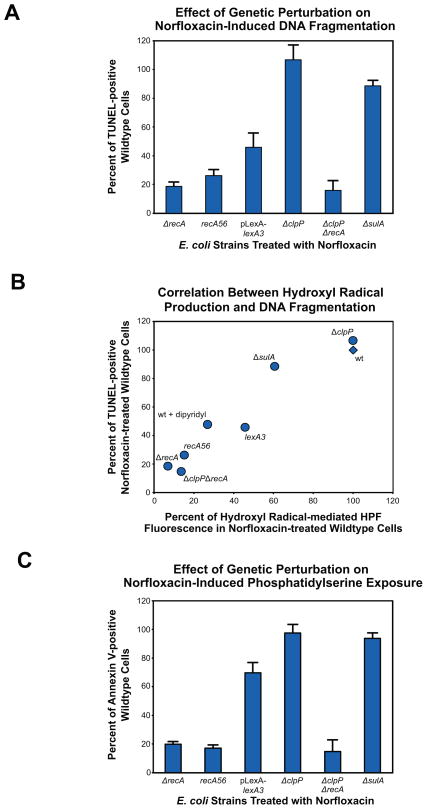
Figure 5. Influence of RecA, ClpP and the SOS response on DNA fragmentation, hydroxyl radical production and phosphatidylserine exposure.
(A) % change in DNA fragmentation detectable by TUNEL (mean ± SD at 4.5 hours post-treatment) exhibited by ΔrecA, ΔclpP, ΔclpPΔrecA and ΔsulA cells, recA56 cells and wildtype E. coli expressing the LexA3(Ind-) mutant repressor protein compared to similarly treated wildtype cells (125ng/mL norfloxacin). (B) Correlation between norfloxacin-induced DNA fragmentation and hydroxyl radical production. Data reflect % change in DNA fragmentation detectable by TUNEL and hydroxyl radical production detectable by the fluorescent dye, HPF (mean ± SD at 4.5 hours post-treatment), compared to similarly treated wildtype cells (125ng/mL norfloxacin). (C) % change in PS exposure detectable by annexin V (mean ± SD at 4.5 hours post-treatments) exhibited by above strains compared to similarly treated wildtype cells (125ng/mL norfloxacin).

