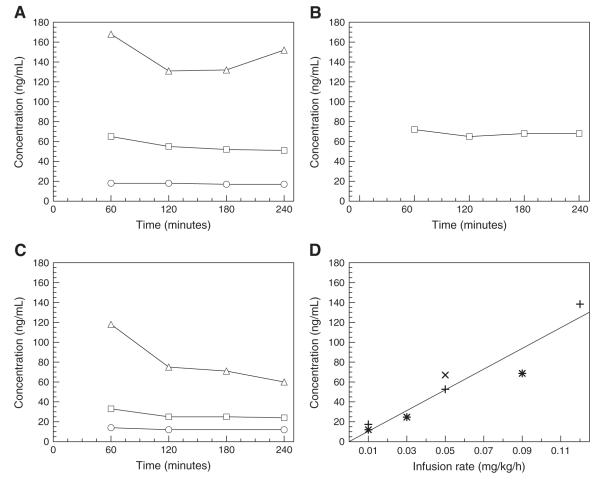
Fig. 2.
(A, B, C) ATX plasma concentration measured for monkeys 1, 2, and 3, respectively, for the low (circle), medium (square) and high (triangle) dose scans. (D) Correlation between the ATX plasma levels and the final infusion rates (infusion II) for monkey 1 (+), 2 (×) and 3 (*), respectively. The regression line was obtained by pooling data from all monkeys (slope=1.04 kg×h/L, r2=0.902, n=7).

