
Fig. 4.
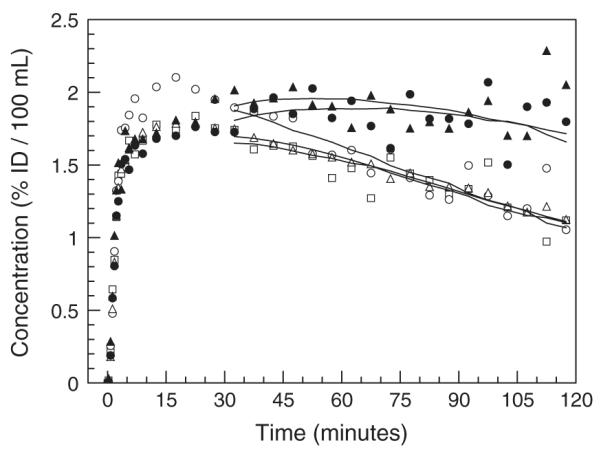
Example of regional time activity curves obtained in one monkey (#2) at baseline in the caudate nucleus (open squares), putamen (open circles), occipital cortex (open triangles), anterior cingulate cortex (solid triangles) and thalamus (solid circles). Solid lines correspond to the MA1 fits.