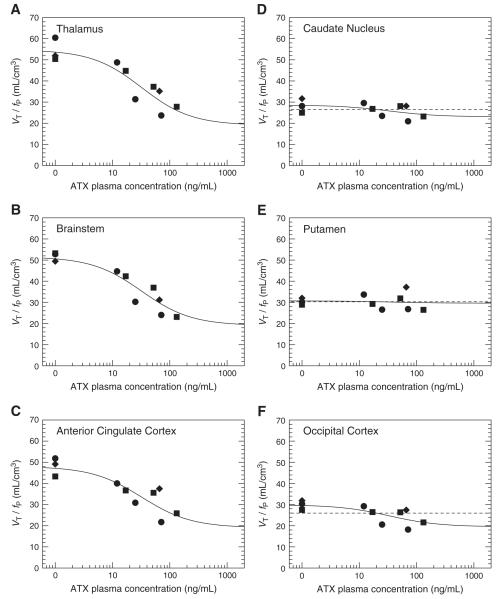
Fig. 6.
The relationship between the normalized distribution volumes (VT/fP) and the plasma levels of ATX three NET-rich regions: thalamus (A), brainstem (B) and anterior cingulate cortex (C); and in three candidate reference regions: caudate (D), putamen (E) and occipital cortex (F). Data obtained from monkey 1, 2 and 3 and represented with circles, diamonds and squares, respectively. In subfigures A to C, the solid line represents the fit obtained using Eq. (5) to estimate the ATX IC50. The parameters IC50 and VND/fP were shared across all NET-rich regions. In subfigures D to F, the two lines represent the fits obtained using Eq. (5), with the IC50 set to the value estimated in NET-rich regions (32 ng/mL), and Bmax/Kd set to zero (dashed line) or fitted (solid line). According to the F test, Bmax/Kd was significantly different from zero in the occipital only.

