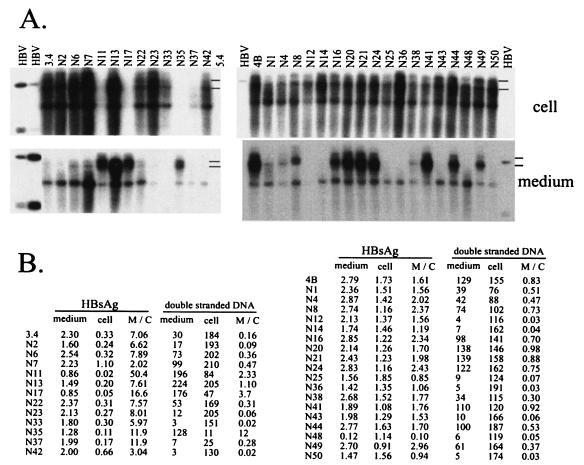
FIG. 10.
Quantitative analysis of virion secretion as well as HBsAg expression and secretion. (A) Southern blot analysis of intracellular HBV DNA (top) and extracellular HBV DNA (bottom). Constructs with low HBsAg expression were grouped on the left, while those with high HBsAg expression were analyzed in a separate experiment (right). Positions of double-stranded DNA are indicated. (B) Quantitative analysis. For 3.4-based constructs (left), HBsAg was analyzed from 40 μl of culture supernatant and 20 μl (1/10) of cell lysate. For 4B- and 6.2-based constructs, HBsAg was measured from 4 μl of culture supernatant and 2 μl (1/100) of cell lysate. Double-stranded HBV DNA in the Southern blots was quantified by densitometric analysis of X-ray films (with unsaturated signals). Values from a same-size spot lacking specific HBV signals were subtracted.

