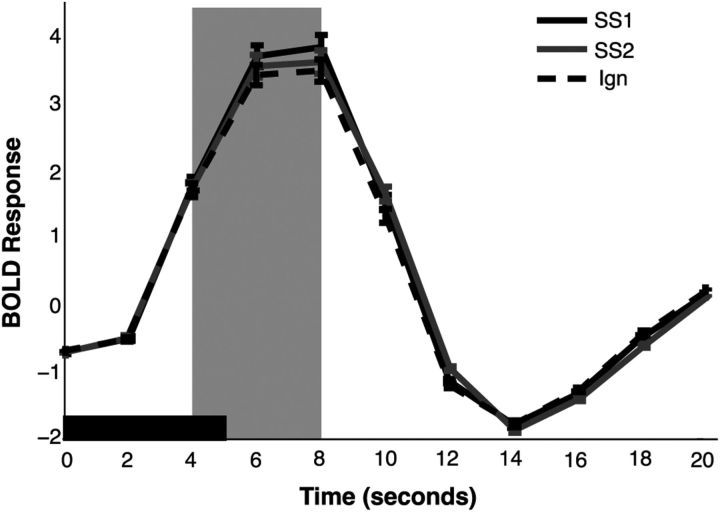
Figure 4.
Event-related analysis of BOLD signal. The mean BOLD response was estimated from the 75% most selective voxels in V1 for both set sizes. The solid black window represents the duration of the stimulus display. Data are collapsed across stimulus orientation. BOLD responses were significantly higher for set size 1 (SS1) trials than set size 2 (SS2) trials during the main analysis window (gray shaded window; p < 0.01). BOLD responses were lowest for the unattended stimulus (Ign). Error bars represent between-subject confidence intervals.

