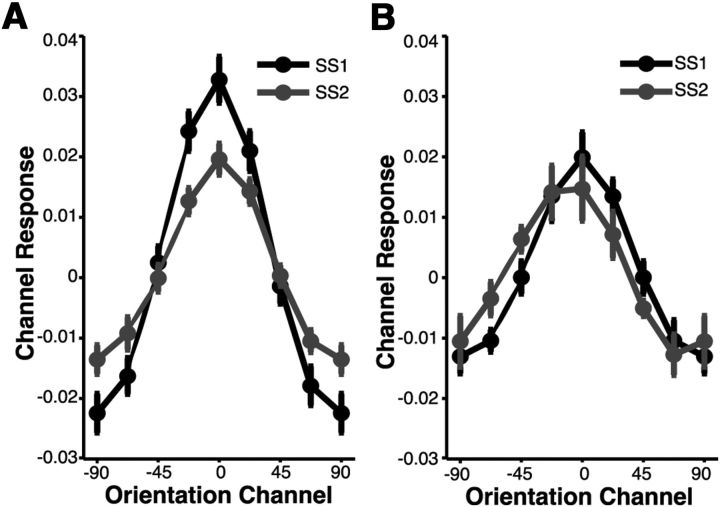
Figure 6.
Population-level orientation-selective responses. A forward encoding model was used to generate orientation-selective population response profiles for each stimulus in the display based on patterns of activity observed in V1. This analysis revealed a similar pattern across set sizes and ROIs (contralateral, ipsilateral): a clear population tuning function emerged that peaked at the channel centered over the orientation of the stimulus and decreased monotonically as the angular distance from this orientation increased. A, Population tuning functions observed in contralateral hemisphere (collapsed across left and right hemifield stimulus presentations) for set size 1 (black; SS1) and set size 2 (gray; SS2) trials. B, Population tuning functions observed in ipsilateral hemisphere (collapsed across left and right hemifield stimulus presentations) for set size 1 and set size 2 trials.

