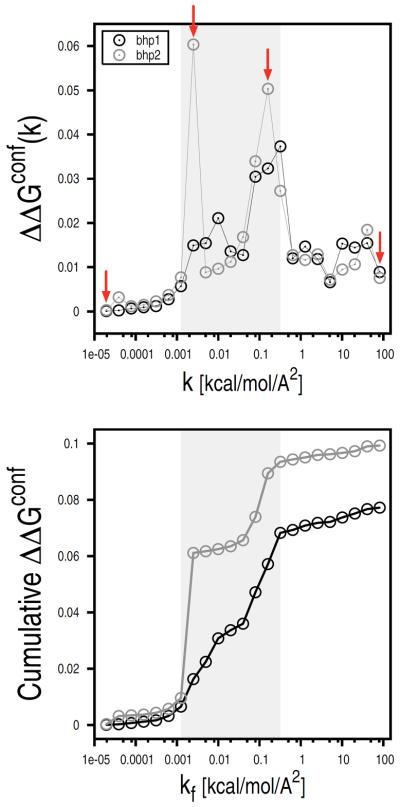
FIG. 7.

Statistical errors in the confinement calculation. Individual (top) and cumulative (bottom) statistical errors of the free energies of confinement for the β-hairpin states are reported as a function of kf. Errors of the individual restrained runs were computed by dividing the MD trajectories into eight blocks. Red arrows indicate the restrained runs that were used for the free-energy profile analysis (see Fig. 9). The largest statistical errors were found in the intermediate k range (0.001 < k < 0.3 kcal/mol/Å2) here shown by a light-grey rectangle (see text).
