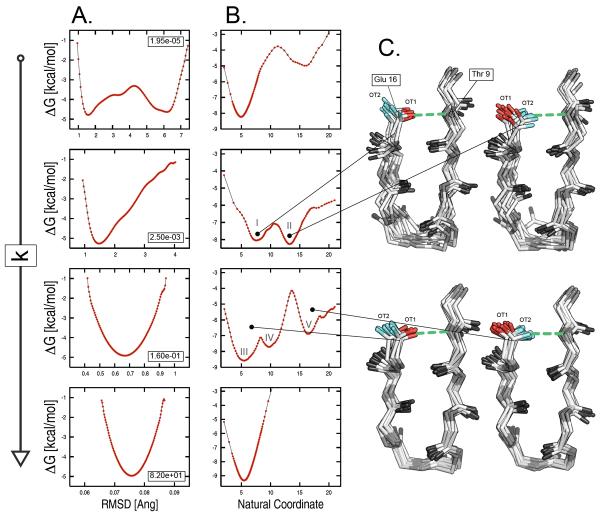
FIG. 9.
Origin of statistical errors in the confinement calculation. The analysis was carried out on a set of four restrained runs for bhp2 with restraint strengths of 1.95e-05, 0.0025, 0.16, and 82 kcal/mol/Å2. The free energy is projected onto (A) the all-atom RMSD from the reference structure and (B) the “natural coordinate” from a principal component analysis of the interatomic distances. The latter shows a complex landscape made of multiple basins separated by high free-energy barriers. Such complexity, which is hidden in the RMSD based free-energy profiles, is responsible for the large statistical errors found in the intermediate k range. (C) Structural analysis of two confinement runs at intermediate k values. Molecular snapshots extracted from basins 4 and 5 for k equal to 0.0025 kcal/mol/Å2, and basins 4 and 7 for k equal to 0.16 kcal/mol/Å2 shows a striking difference in the H-bonding interaction between Thr 9 and Glu 16: the H-bond (green dashed line) involves oxygen OT1 of Glu 16 (red stick) in the former basins, and oxygen OT2 (cyan sticks) in the latter.

