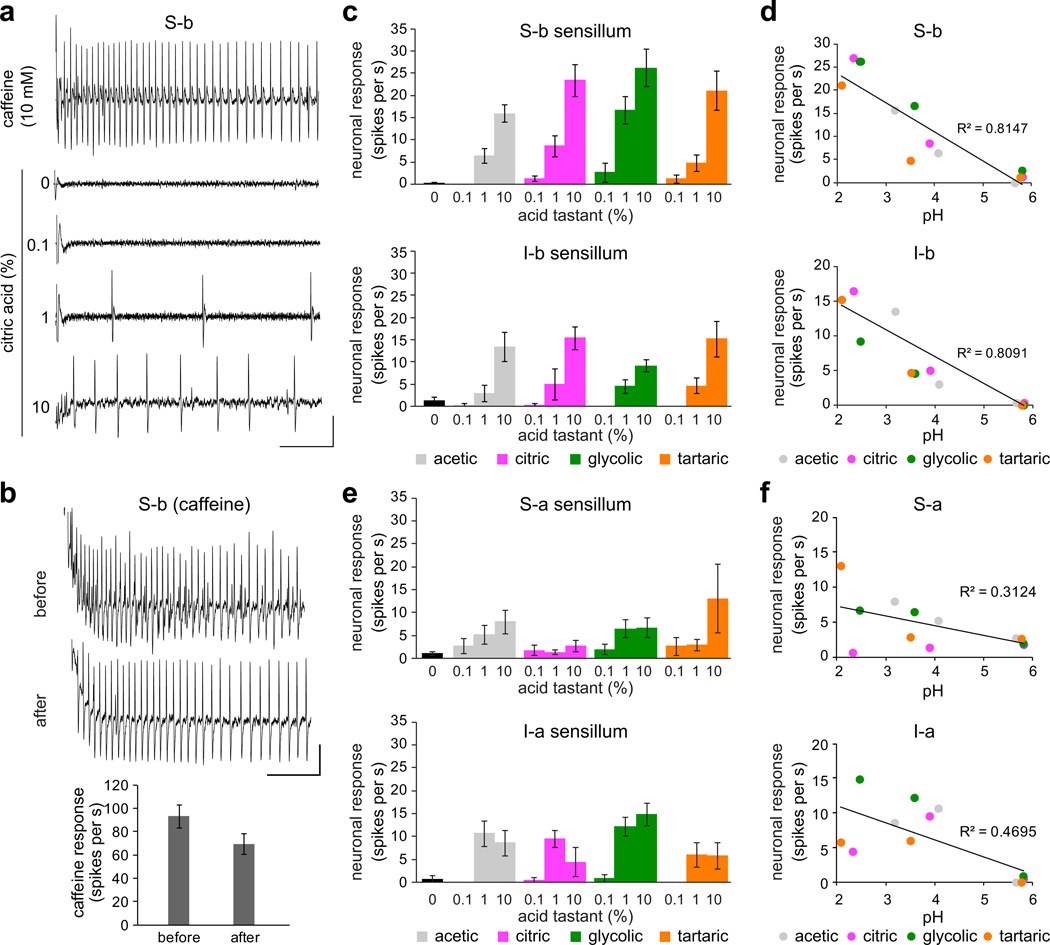
Figure 2. Fruit acid tastants activate a subset of bitter neurons.
a. Representative traces of recordings obtained from S-b labellar sensilla of wild-type flies. Vertical bar = 1 mV; horizontal bar = 100 ms. b. Representative 10 mM caffeine traces and mean firing rates of the bitter neuron obtained before and after stimulation with acid tastants. n=9. P = 0.305, Student’s t-test. Independent recordings were acquired over 2 days. Vertical bar = 1 mV; horizontal bar = 100 ms. c. Mean responses of S-b and I-b classes of bitter-responsive sensilla to indicated acid tastants and 30 mM tricholine citrate electrolyte control (0). S-b: n=30 (“0” control), n=9–14 (acetic), n=10–11 (citric), n=8–9 (glycolic), n=10–11 (tartaric). I-b: n=22 (“0” control), n=6–12 (acetic), n=6–10 (citric), n=7–10 (glycolic), n= 9–10 (tartaric). For each sensillum-stimulus series, independent recordings were acquired over 2–6 days. d. Scatter plots of mean responses of S-b and I-b sensilla to acid tastants tested at 0.1%, 1%, and 10% from c, against pH of the stimulus mixtures. Three independent pH measurements were taken and averaged for each stimulus solution. Best fit lines and R2 values were calculated in Excel. e. Mean responses of wild-type S-a and I-a classes of bitter-responsive sensilla to indicated acid tastants and 30 mM tricholine citrate electrolyte alone (control). S-a: n=29 (“0” control), n=8–14 (acetic), n=10–14 (citric), n=8–11 (glycolic), n=9–11 (tartaric); Ia: n=7 (“0” control), n=9–10 (acetic), n=8–9 (citric), n=9 (glycolic), n=9 (tartaric). For each sensillum-stimulus series, independent recordings were acquired over 2–6 days. f. Scatter plots of mean responses of indicated sensilla to acid tastants tested at 0.1%, 1%, and 10%, against pH of the stimulus mixtures. Three independent pH measurements were taken and averaged for each stimulus solution. Best fit lines and R2 values were calculated in Excel. Error bars = s.e.m.

