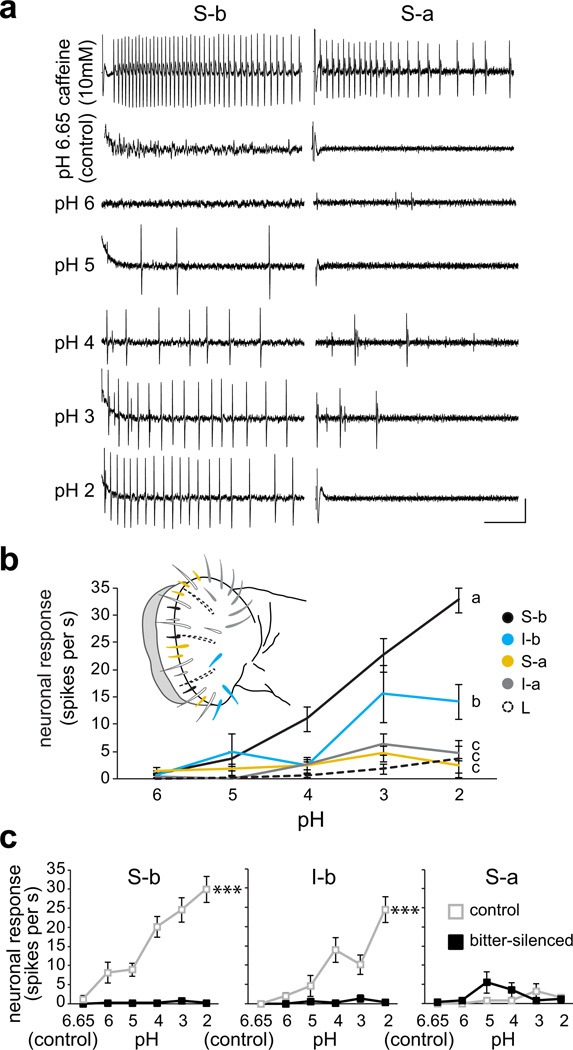
Figure 3. Bitter taste neurons are activated by acidic pH.
a. Representative traces of hydrochloric acid (HCl) responses obtained from S-b and S-a sensilla of wild-type flies. Vertical bar = 1 mV; horizontal bar = 100 ms. b. Mean responses of four classes of labellar sensilla to solutions of HCl at indicated pH; corresponding sensillar classes are indicated in the schematic of the labellum. n=12 (S-b), n=9 (I-b), n=9 (S-a), n=5–10 (I-a), n=10 (L). Lines with different letters are significantly different, P < 0.001 (S-b), P < 0.001 (I-b), P = 0.861 (S-a), P = 0.478 (I-a) versus L-type, 2-way ANOVA with Tukey’s post hoc analysis. For each sensillum, independent recordings were acquired over 2–3 days. c. Mean responses to 30 mM tricholine citrate electrolyte alone (pH 6.65, control) and standardized HCl solutions in electrolyte (pH 2–6) of indicated sensilla in control (Gr89a–GAL4/+;+/TM3) and bitter-silenced (Gr89a-GAL4/+;UAS-Kir2.1/TM3) flies. Control: n=12 (S-b), n=9 (I-b), n=5 (S-a); bitter-silenced: n=10 (S-b), n=10 (I-b), n=5 (S-a). ***P < 0.001, 2-way ANOVA with pairwise comparisons. For each sensillum, independent recordings were acquired over 3–5 days.

