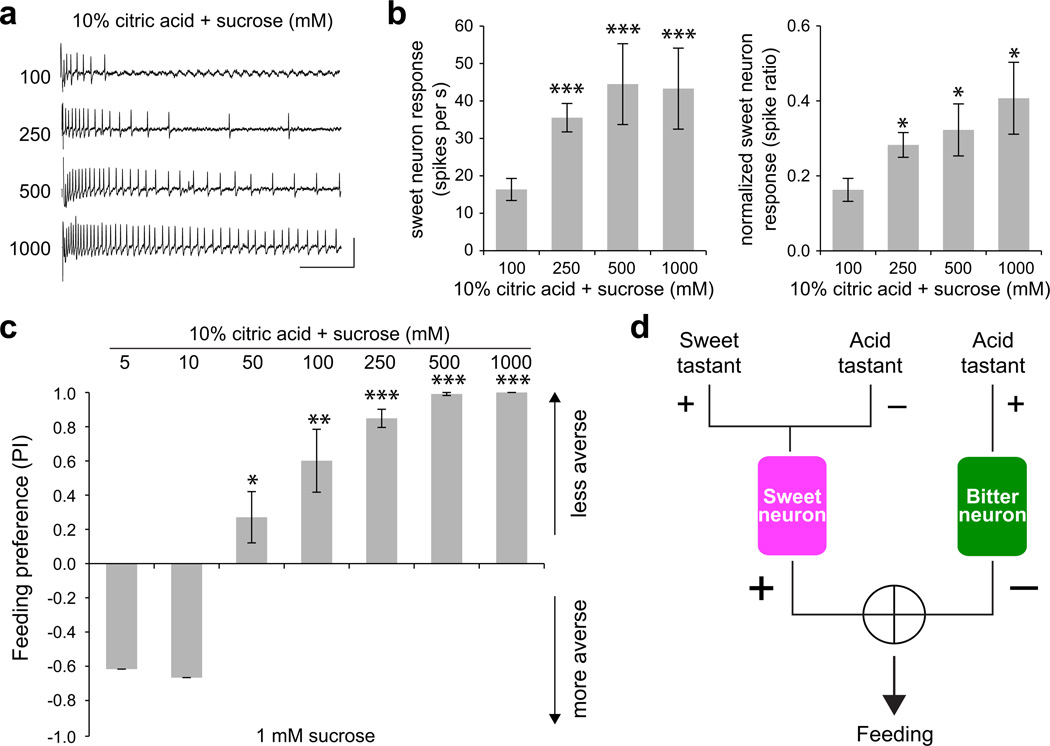
Figure 8. Acid inhibition of sweet neurons is relieved by increases in sucrose concentration.
a. Representative traces of recordings from a single L-type sensillum of a wild-type fly. Vertical bar = 1 mV; horizontal bar = 100 ms. b. Mean responses (left) and responses normalized to the corresponding concentration of sucrose (right) obtained for sweet taste neurons in L-type sensilla. n=10–15. *P < 0.05, ***P < 0.005, versus mixture with 100 mM sucrose, Student’s t-test. Independent recordings were acquired over 2 days. c. Results of binary choice assays using indicated mixed stimuli tested against 1 mM sucrose. n = 3–10. *P < 0.05, **P < 0.01, ***P < 0.005, Student’s t-test. Error bars = s.e.m. Independent trials were performed over 2 days. d. A model for the detection of acid tastants by the Drosophila taste system.

