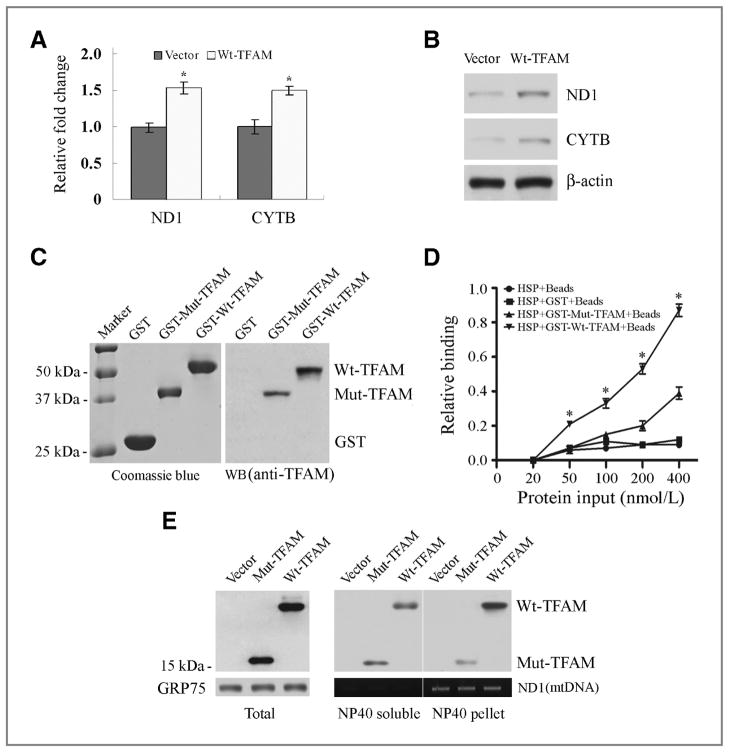
Figure 5.
Aberrant regulation of CYTB transcription by Mut-TFAM in CRC with MSI. A, qRT-PCR analysis of ND1 and CYTB mRNA in RKO cells expressing Wt-TFAM or vector. Values represent mean ± SD of 3 analyses, P < 0.05 for both. B, Western blots showing ND1 and CYTB protein levels in RKO cells as in (A). C, purified GST-Wt-TFAM and GST-Mut-TFAM fusion proteins were visualized by Coomassie blue staining (left) and Western blot with anti-TFAM antibody (right). D, relative binding ability of Wt-TFAM or Mut-TFAM to mitochondrial HSP. Data represent mean ± SE of 3 independent experiments in triplicate, P < 0.01. E, distribution of Wt-TFAM and Mut-TFAM in the NP40-soluble or -insoluble fraction of mitochondrial extracts from RKO cells expressing control vector, Wt- or Mut-TFAM. GRP75 was a loading control for mitochondrial protein; ND1 was PCR-amplified to serve as a mtDNA loading control.

