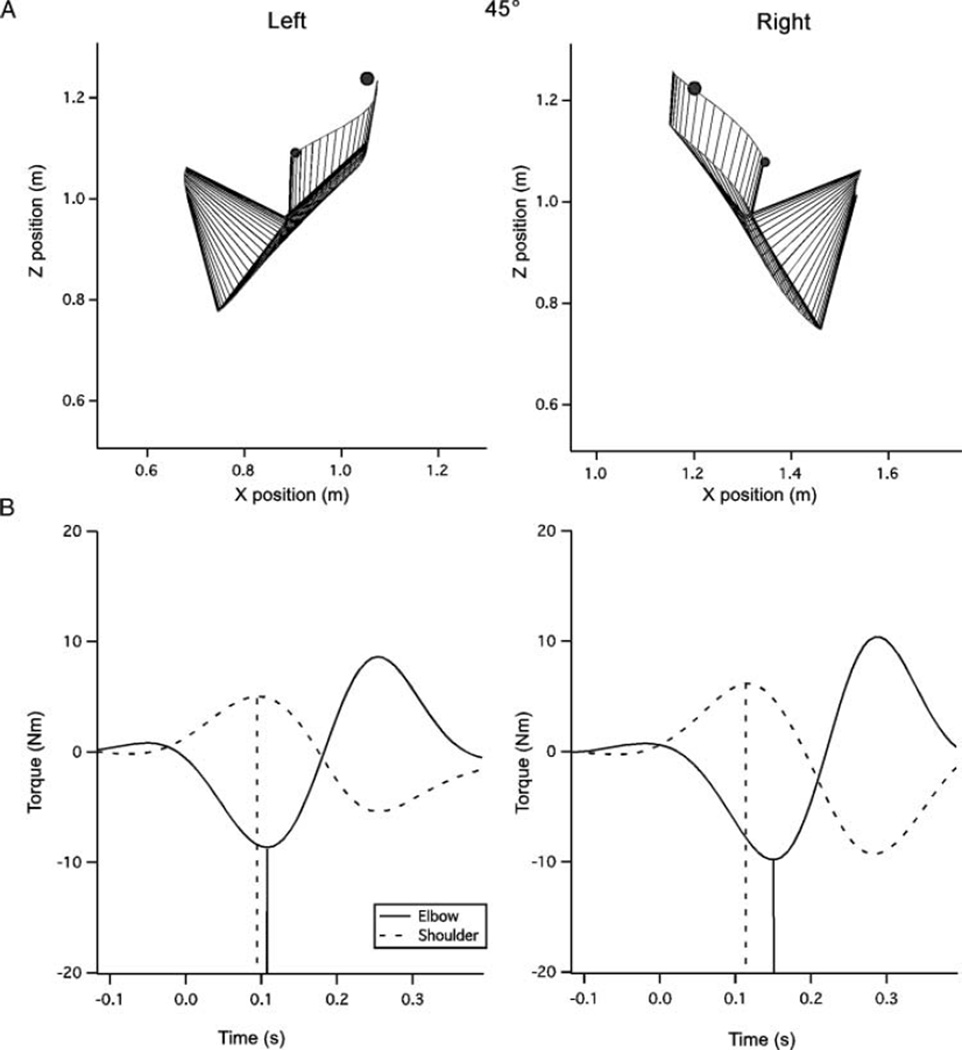
FIGURE 5.
Sample movements to the 45° target. (A) Movement plots for the right and left arms. Movements of both arms display the most curvature to this target, however, dominant arm movements show less differences from the 0° target than the nondominant. The nondominant arm shows a notable undershoot in the initial direction, while the dominant paths tend to be directed at the target or slightly above it. (B) Net torques at the elbow and shoulder joints. Vertical lines denote the time of peak torque incidence.

