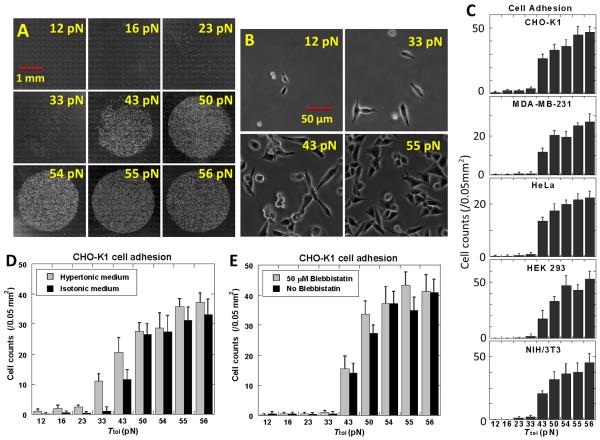
Fig. 2.
Cell adhesion on TGT with RGDfK. (A) Phase contrast images of adherent CHO-K1 cells (white dots) on circular regions coated with nine TGT constructs of RGDfK-conjugated dsDNA with the indicated Ttol values. (B) Zoomed in phase contrast images of CHO-K1 cells on four of the regions. (C). Cell density (counts per 0.05 mm2) as a function of Ttol for five different cell lines as indicated. (D) Cell density vs. Ttol for CHO-K1 cells in hypertonic vs. isotonic medium. (E) Cell density vs. Ttol for CHO-K1 cells with and without 50 μM Blebbistatin. All error bars denote the standard deviation (n=8).

