
Figure 4.
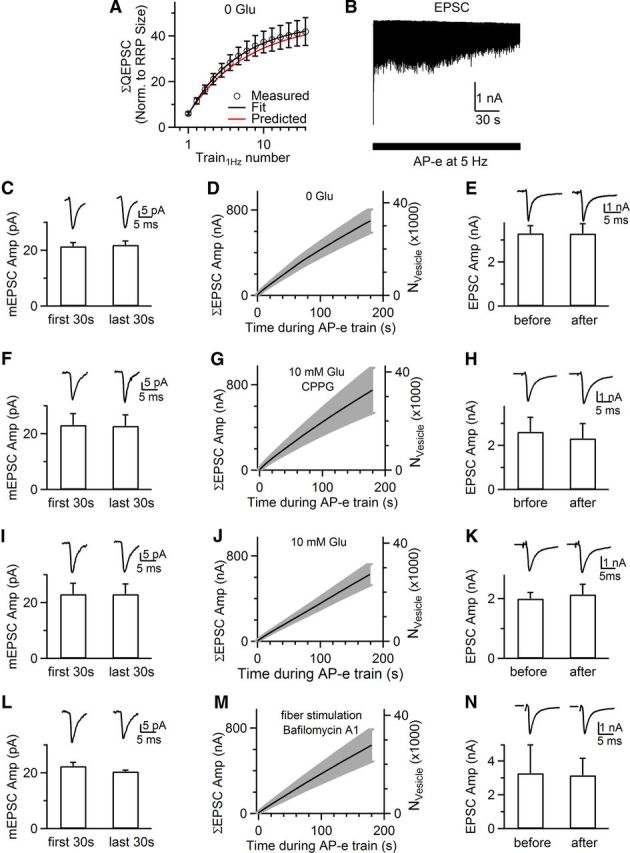
Large recycling pool. A, The accumulated QEPSC (ΣQEPSC, circles) induced by Train1Hz applied every 30 s is plotted versus the Train1Hz number in the absence of glutamate (analyzed from Fig. 1C). ΣQEPSC is normalized to the QEPSC induced by the first 20 ms depolarization of the first Train1Hz, i.e., the RRP size. Black curve is a monoexponential fit with a plateau value of 46 times the RRP size. The red curve is the predicted change assuming random mixture of recycling vesicles (see Results). B, Sampled EPSCs induced by a presynaptic AP-e train at 5 Hz for 180 s (bar) with no glutamate in the pipette (applies to B–E). C, The mEPSC amplitude (n = 8 synapses) in the first and the last 30 s during the AP-e train at 5 Hz for 180 s. Sampled mean mEPSCs at the same time period from a synapse shown in B are also plotted above the bar graph (left: averaged of 97 mEPSCs; right: 93 mEPSCs). D, The cumulative EPSC amplitude (ΣEPSC Amp) and the number of vesicles (Nvesicle) released by an AP-e train at 5 Hz (n = 8 synapses). Data are shown as the mean (solid curve) ± SEM (gray). E, The amplitude of EPSCs (bottom) and sampled EPSCs (top, from one synapse) induced by an AP-e at ∼30 s before (left) and after (right) an AP-e train at 5 Hz for 180 s (n = 8 synapses). F–H, Same arrangements as in C–E, respectively, except that the pipette contained 10 mm glutamate and the bath contained 300 μm CPPG (n = 5 synapses). mEPSC traces in F: left, averaged of 47 mEPSCs; right, 56 mEPSCs. I–K, Same arrangements as in C–E, respectively, except that the pipette contained 10 mm glutamate (no CPPG in bath, n = 5 synapses). mEPSC traces in I: left, averaged of 136 mEPSCs; right, 58 mEPSCs. L–N, Same arrangements as in C–E, respectively, except that whole-cell AP-e was replaced with an extracellular stimulation that induced axonal action potentials (see Results), and the bath contained 6 μm bafilomycin A1 (n = 4, synapses). mEPSC traces in M: left, 44 mEPSCs; right, 51 mEPSCs.