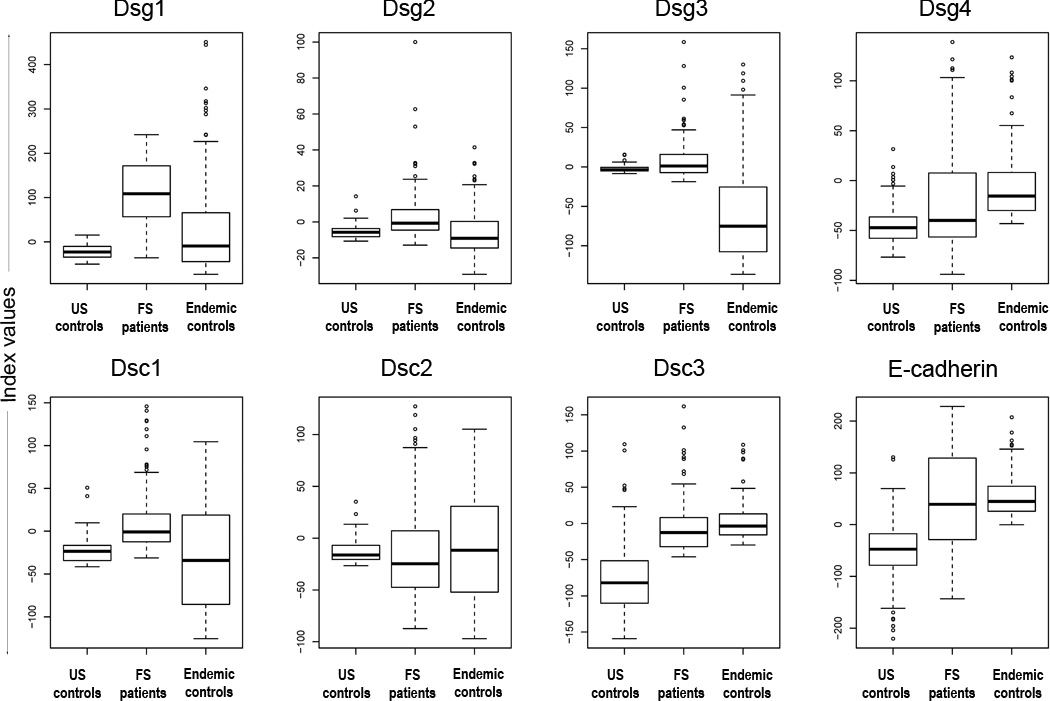
Figure 1.

The distribution of index values among US controls, FS patients, and endemic controls. Dsg1 ELISA index values show the greatest separation of FS patients from both sets of controls (p<0.0001), but show no difference between the control groups (p=0.0162). Each box extends from the lower to the upper quartile (25–75%) with the median shown as a thick line within the box. The whiskers extend away from the box to the most extreme data point, which is no more than 1.5 times the length of the box. Data points beyond the whiskers are individually marked.
