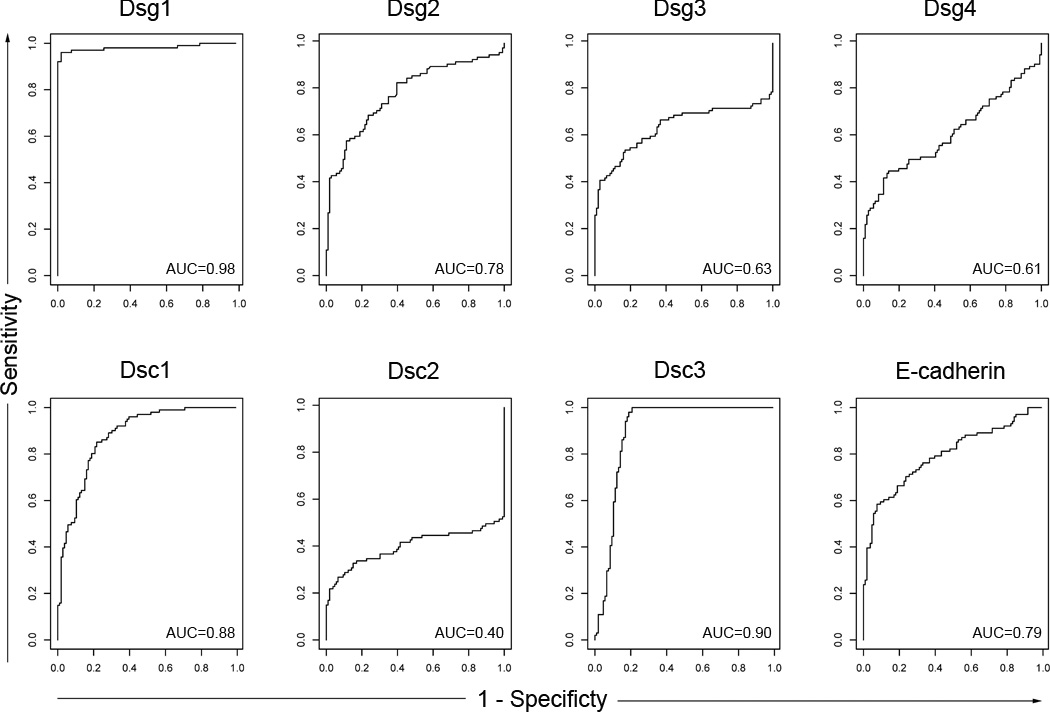
Figure 2.

Receiver operator characteristic curves (ROC curves) generated from US controls and FS patient data. The ROC curve is a scatter plot of sensitivity against 1-specificity as the cutpoint is varied over the entire range of index values. The area under the curves (AUCs) generated from these curves are shown in the right lower quadrant of each ROC box. The AUCs show that the highest performing antigen/antibody systems are Dsg1 (0.098), Dsc1 (0.88), and Dsc3 (0.90).
