
Figure 3.
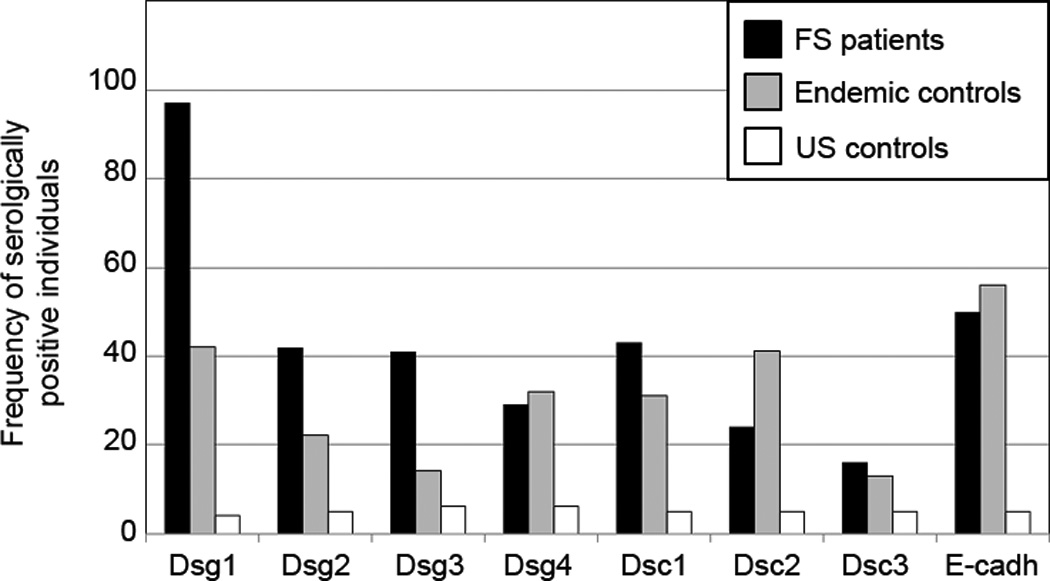
Percentage of serologically positive individuals among FS patients, endemic controls, and US controls for each of the eight antigen/antibody systems. This bar graph represents positive sera as defined by the cutpoint. FS patients (black bars), endemic controls (grey bars), and US controls (white bars) are shown.