Figure 6.
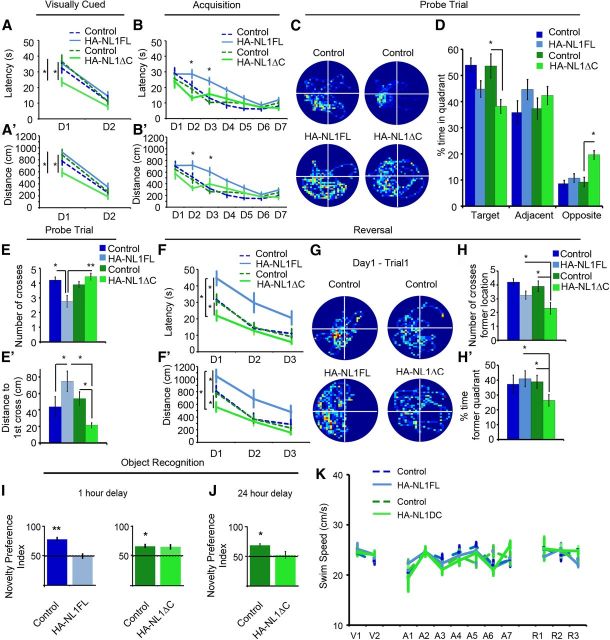
Manipulations of NL1 intracellular signaling distinctly alters performance in learning and memory behaviors. A, Mean latency in seconds (s) of transgenics (solid, light blue, and green lines) and their controls (dashed, dark blue, and green lines) during the visually cued training trials. Days of training labeled D1–D2. A′, Mean distance traveled before reaching the platform in the visually cued training trials. B, Mean latency in seconds (s) to find hidden platform during acquisition training showing significant differences in the performance of only the HA-NL1FL mice from controls. B′, Mean distance traveled before reaching the hidden platform during acquisition training showing significant differences in distances traveled to reach the platform. C, Representative paths traveled from each group of mice during a 60 s probe trial after acquisition training showing significant changes in searching behavior. All plots were oriented to align the target quadrant to the lower left for comparison purposes. D, Significant differences in percentage time spent in either the target quadrant, quadrants adjacent to the target, or the opposite quadrant during the 60 s probe trial for the transgenics (light blue and green bars) versus each other and their controls (dark blue and green bars). E, Significant differences in mean number of crosses of former platform location and (E′) mean distance in centimeters to reach former target location during the 60 s probe trial following acquisition. F, Significant differences in mean latency in seconds (s) and (F′) mean distance traveled (cm) to reach new platform location in reversal training. Transgenics are labeled as solid, light blue, and green lines and their controls are dark blue and green, dashed lines. Days of training labeled D1–D3. G, Representative search paths on the fourth training trial of Day 1 of reversal training revealing distinct differences between transgenics and their controls. The former target location has been aligned to the lower left quadrant for comparison between groups, meaning the new location is in the upper right quadrant. H, Mean number of crosses over former target location and (H′) percentage time in former target quadrant during the fourth training trial of the first day between transgenics and controls serves as a measure of persistence in using old information after experiencing new conditions. I, Object recognition memory to assess short-term memory, 1 h delay between object exposure, and (J) long-term memory, 24 h delay, differences between HA-NL1FL mice (light blue bars) and HA-NL1ΔC mice (light green bars). K, Comparison of swim speeds in cm/s between transgenic mice (solid, light blue, and green lines) and their controls (dashed, dark blue, and green lines) during distinct phases of water maze training. Days of visual training, V1–V2; days of acquisition training, A1–A7; and days of reversal training, R1–R3. All data shown are mean ± SEM, significance determined with repeated-measures ANOVA with Tukey–Kramer HSD, post hoc, *p < 0.05, n = 21 littermate pairs (10–11 double positive transgenic in each group or 10–11 mixed single transgenic controls).

