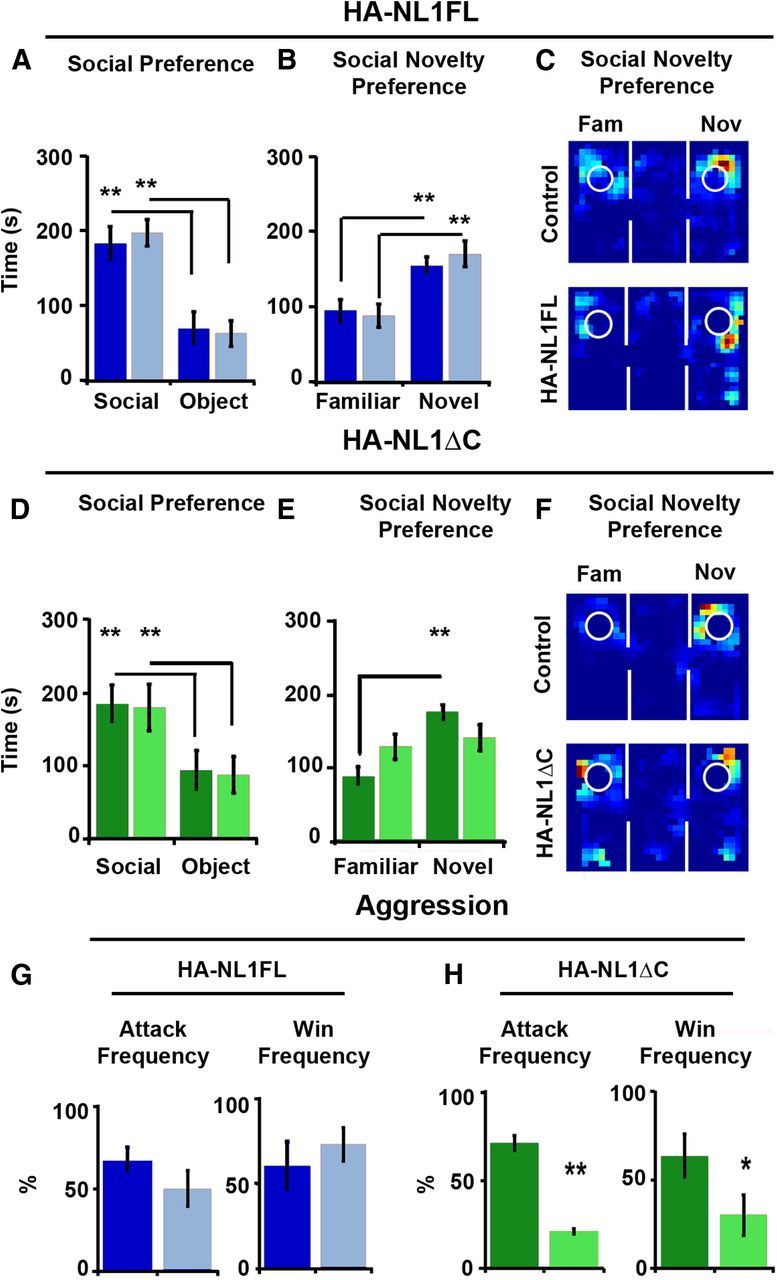
Figure 7.

Manipulations of NL1 intracellular signaling affect social behavior. A, Performance in the three-chambered social preference task. Mean time in seconds (s) spent in the chamber, with either a social partner (Social) or an object (Object), is depicted for both controls (dark blue bars) and HA-NL1FL mice (light blue bars) in the left graph. B, Mean time spent in a chamber with either a familiar social partner (Familiar) or a novel social partner (Novel) is depicted. C, Representative exploration paths during a choice to investigate a familiar or a novel social partner, control performance at top, and HA-NL1FL performance at bottom. D, Preference for social interaction over interaction with an object for control (dark green bars) and HA-NL1ΔC mice (light green bars). E, Significant differences in preference for familiar animals versus novel animals in controls (dark green bars) versus HA-NL1ΔC mice (light green bars). F, Representative exploration paths during a choice to investigate a familiar or a novel social partner, control performance at top, and HA-NL1ΔC performance at bottom. G, Left, Attack frequency differences during the resident–intruder task after prolonged social isolation between controls (dark blue) and HA-NL1FL mice (light blue). Right, Win frequency during the dominance tube test is graphed to the right. H, Left, Attack frequency differences during the resident–intruder task after prolonged social isolation between controls (dark green) and HA-NL1ΔC mice (light green). Right, Win frequency differences between controls and the HA-NL1ΔC mice. All data shown are mean ± SEM, significance was determined with repeated-measures ANOVA, with Tukey–Kramer HSD post hoc, *p < 0.05, **p < 0.01, n = 21 pairs (10–11 double positive transgenic in each group or 10–11 mixed single transgenic controls).
