
Figure 4.
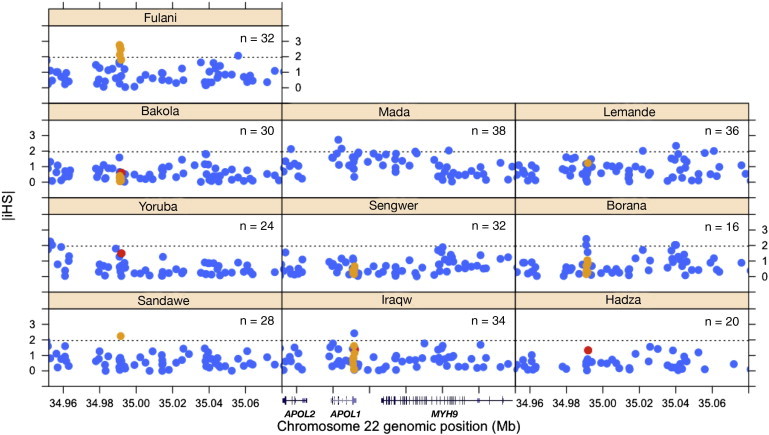
Plots of iHS Values for SNPs of APOL1 and the Adjacent Chromosomal Regions in African Populations
The absolute values of standardized iHS (|iHS|) are plotted against the genomic positions (NCBI Genome browser build 36.1) of SNPs at APOL1 and the neighboring genetic regions on chromosome 22 for a subset of our samples in each population. The number of chromosomes (n) is given for each population. The estimates of |iHS| are colored in red for the G1 SNPs and in orange for the G3 SNPs. The 95% cutoff value (1.96) of the empirical distribution of standardized iHS is given in each plot (dashed line).