
Figure 1.
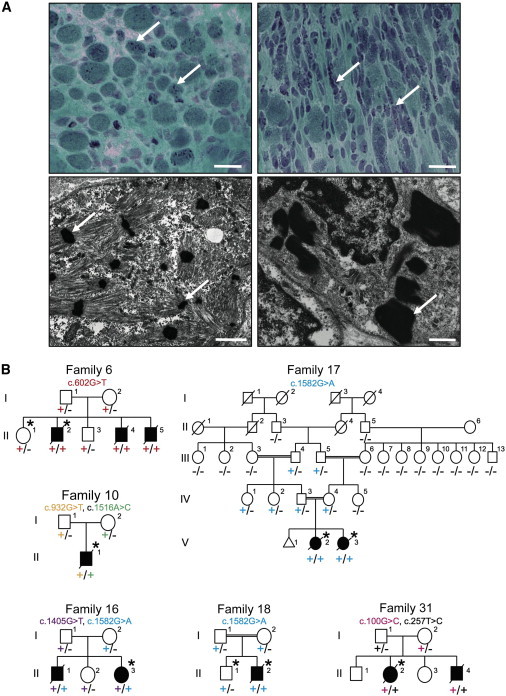
Family Pedigrees and Light and Electron Microscopy of Muscle Biopsies
(A) Modified Gomori trichrome (upper) and electron microscopy (lower) of muscle biopsies from affected individuals of families 15 (right) and 20 (left). Abnormal variation in fiber size, together with many small myofibers and sometimes increased connective tissue, and the presence of numerous red- or purple-stained nemaline bodies (arrows) can be seen (upper panels). Numerous nemaline bodies with varying sizes and shapes and a lack of normal myofibrils are visible by electron microscopy (arrows). Scale bars represent 20 μm for modified Gomori trichrome and 1 μm for electron microscopy.
(B) Pedigrees for the families in which exome sequencing and analysis were performed on the probands. Asterisks indicate the individuals whose DNA was analyzed by exome sequencing. Segregation of the mutations identified in each pedigree is shown.