
Figure 6.
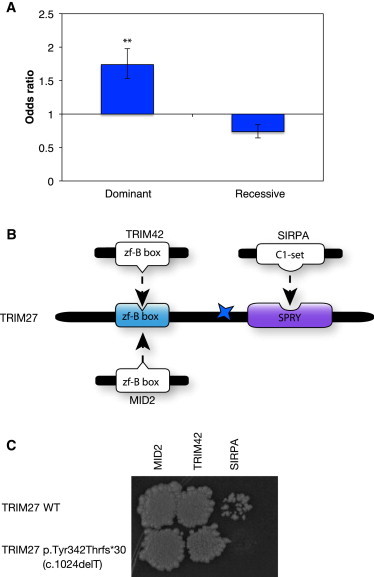
Enrichment of Truncating Mutations in Regions Encoding Sequences between Two Interaction Interfaces
(A) ORs of dominant and recessive truncating mutations affecting regions between interaction interfaces. ∗∗p < 10−20, ∗p < 0.05. The p values were calculated with Z-tests for the log OR. Error bars represent 95% confidence intervals of ORs.
(B) Illustration of TRIM27 and its interaction interfaces with MID2, TRIM42, and SIRPA. The colored star indicates the location of the experimentally tested mutation (c.1024delT [p.Tyr342Thrfs∗30]).
(C) Y2H-tested effects of truncating mutation c.1024delT (p.Tyr342Thrfs∗30) on the interactions of TRIM27.