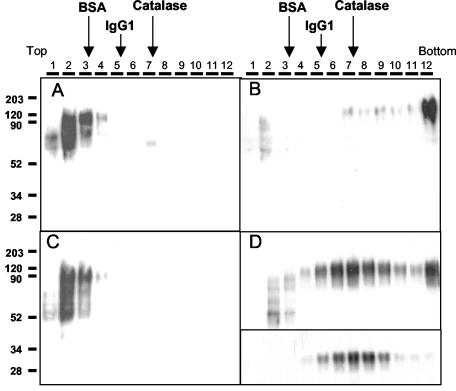
FIG. 2.
Sedimentation of Gs and Gm proteins in sucrose gradients. The purified Gs (A and C) and Gm (B and D) proteins from Fig. 1 were loaded onto preformed 5 to 25% sucrose gradients and then centrifuged and processed as indicated under Materials and Methods. Sedimentation proceeds from left to right. Both samples and gradients shown in panels C and D contained 0.1% octyl-glucoside in PBS, whereas those displayed in panels A and B did not contain detergent. Thirty microliters from each gradient fraction (shown at the top of each panel) were analyzed by Western blotting using antibody 63G. Fractions 5 to 9 of the gradient shown in panel D were pooled together, equilibrated in PBS containing 0.1% octyl-glucoside, and centrifuged a second time in a new 5 to 25% sucrose gradient prepared in PBS containing 0.1% octyl-glucoside. Western blot analysis of fractions obtained from the latter gradient is shown in the inset of panel D. Gradients run in parallel in the absence of detergent were loaded with either BSA (68 kDa), mouse immunoglobulin G1 (IgG1; 150 kDa), or catalase (250 kDa). Fractions of these gradients were analyzed by SDS-PAGE and Coomassie blue staining. The peak of the protein sedimentation profile in each of these gradients is indicated (arrows).

