
Figure 1.
Comparisons of Meta and Joint Analysis of SKAT and SKAT-O
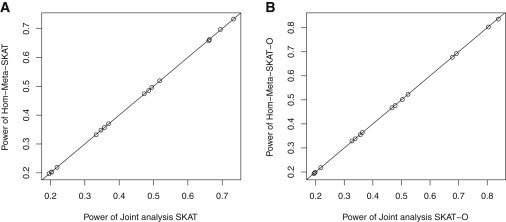
Sixteen dots represent sixteen combinations of scenarios (scenarios 1 and 4), the percentage of causal variants (5%, 10%, 20%, and 50%), and the percentage of risk-decreasing variants (0% and 20%). Empirical powers were obtained at α = 2.5 × 10⁻⁶.
(A) Comparison of Hom-Meta-SKAT and joint analysis SKAT.
(B) Comparison of Hom-Meta-SKAT-O and joint analysis SKAT-O.