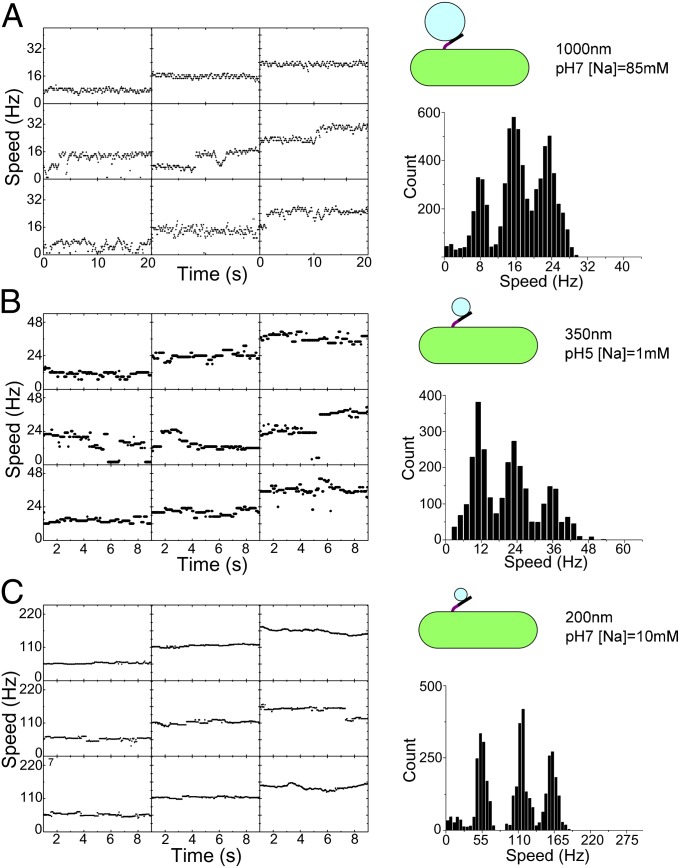
Fig. 2.
Measurement of single-stator speeds. (Left) Speed-time traces from nine different representative cells recorded at the same Vm and Δμ/q with a particular bead size (3 of the total of 125 combinations of SMF and bead size are shown; all 125 are shown in Fig. S1). (Right) Histograms of all speeds recorded under the same conditions. Histograms show distinct peaks corresponding to different numbers of stators in the motor; occasional discrete changes in stator number are visible in the speed-time traces. The single-stator speed was taken from the lowest peak.

