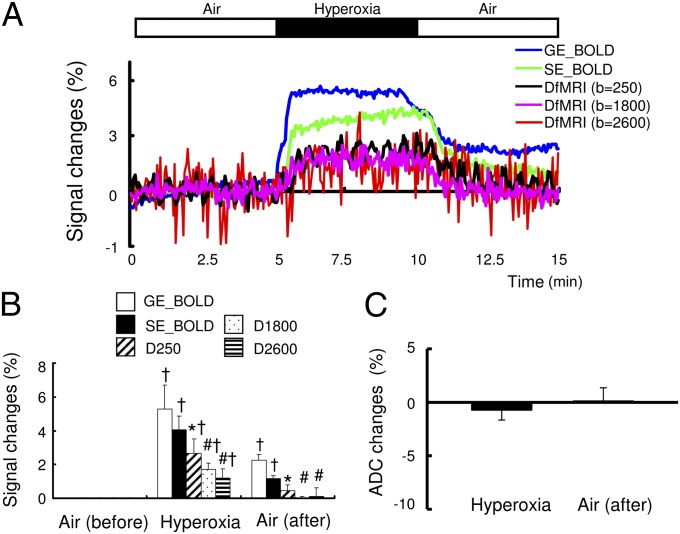
Fig. 4.
(A) Time course of BOLD (GE and SE), diffusion-weighted MRI (b = 250, 1,800, and 2,600) and ΣLFPs responses with hyperoxia condition under 1.5% anesthesia. (B) Peak value of BOLD and DfMRI responses and (C) ΣLFP changes. *P < 0.05 compared with GE-BOLD; #P < 0.05 compared with GE- and SE-BOLD; †P < 0.05 compared with basal. Statistical comparison between BOLD and DfMRI (all b value) was done using ANOVA and post hoc Tukey–Kramer test for group comparisons. The statistical comparison with the basal level was done using paired t test. Data were expressed as mean ± SEM.

