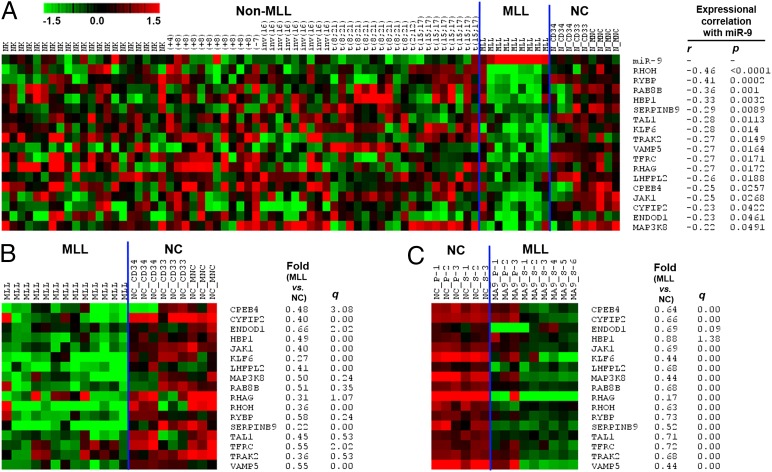
Fig. 5.
Expression profiles of 17 candidate target genes of miR-9 in MLL-rearranged AML. Expression data were mean centered, and the relative value for each sample is represented by a color, with red representing high expression and green representing low expression (scale shown in the upper left). (A) Expression profiles of miR-9 and its 17 candidate target genes in the 79 human sample set (including 9 MLL-rearranged AML, 61 non–MLL-rearranged AML, and 9 normal control samples) and their expressional correlations are shown. (B) Expression profiles of the 17 candidate target genes in the 22 human sample set including 13 MLL-rearranged AML and 9 normal control samples. (C) Expression profiles of the 17 candidate target genes in the 15 mouse sample set including 9 MLL-rearranged AML and 6 normal control samples. The fold changes and corresponding q values (as detected by SAM) of the 17 target genes in MLL-rearranged AML samples compared with normal controls are shown in B and C.

