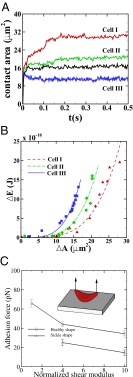
Fig. 2.
Adhesion in static conditions: (A) Instantaneous contact area between the SS-RBC and the plate coated with adhesive ligands. Black curve represents the contact area of a discocyte with cell rigidity similar to the ISC (cell III). (B) Increase of cell free energy as a function of the contact area. (C) Adhesive force between the cell and the plate as a function of the membrane rigidities for cell morphologies. Error bar represents the adhesive force computed from four independent simulations. (Inset) Sketch of the simulation setup, where a uniform lift force is applied on the upper part of an ISC.

