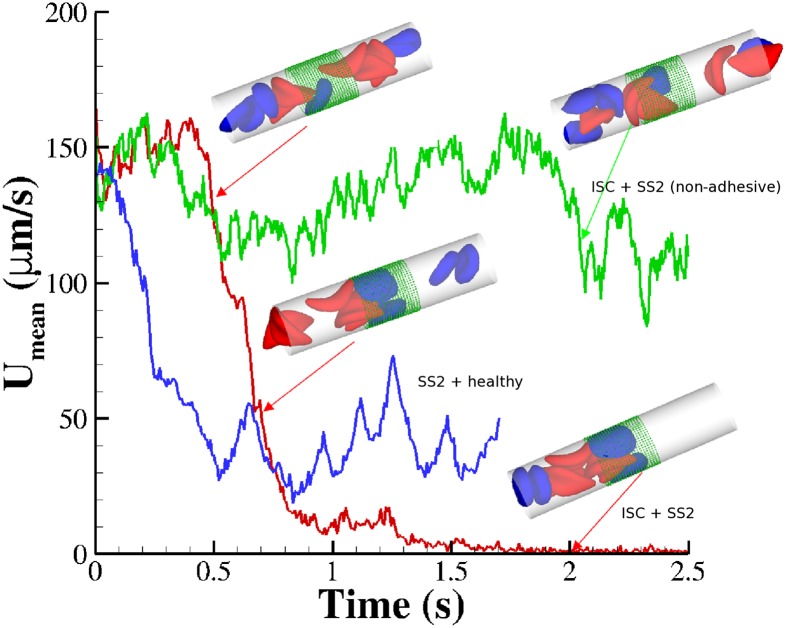
Fig. 3.
Vasoocclusion in postcapillaries: instantaneous mean velocity of blood flow in a cylindrical tube of  infused with different SS-RBC suspensions. Red curve represents the resultant velocity infused with SS2 and ISC cell groups. (Inset) Instantaneous snapshots where SS2 cells adhere to vessel wall, consequently trapping the ISCs and resulting in cell blockage. Green curve represents the blood velocity infused with SS2 and ISC cell groups, where adhesive interaction is only applied to the ISC group. The time axis is scaled by 0.5 for better visualization. The Inset represents a snapshot where transient adhesion is established between ISC and the tube wall. Steady flow is recovered as the cell detaches from the tube wall. Blue curve represents the instantaneous velocity of blood flow infused with SS2 and healthy cell groups. Blood flow exhibits a slowdown but not a full occlusion; Movies S2, S3, and S4.

